![]()
![]()
![]()
PRAC #4
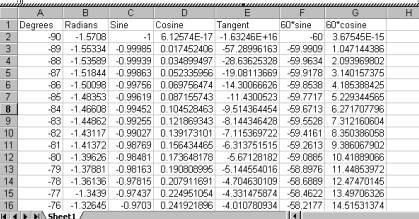
TRIG FUNCTIONS
SINE,
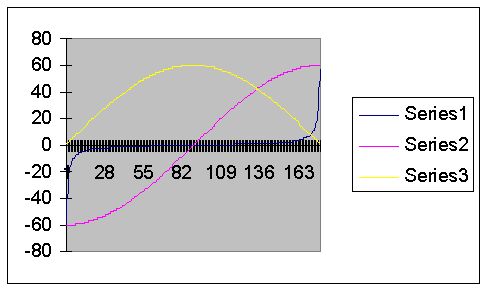
COSINE, and TANGENT can be displayed on the same chart. Use a spreadsheet to
display over the range -90<q<90.
Sine
and cosine functions have a maximum value of 1. Tangent has a maximum value of
infinity. In order to display a readable chart we need to distort the sine and
cosine by multiplying by 60 and leaving out some values for the tangent.
Remember, a chart can distort or mislead by not including all information.
![]()
![]()
![]()