

| Home | Table of Content | Final Report | Cover Letter | Executive Summary | Introduction | Conclusions | Recommendations |
The following section discusses the methodology that we used to define and support our recommendation.
Methodology 1: Reduce the assembly workers walking distance
The following methodology was used to determine exactly how far the assembly line workers are walking.
Each trip an employee makes to the back wall was is forty-two feet. Thus, it takes an employee eighteen seconds, or three-tenths of a minute to leave the assembly line to retrieve parts from the back wall. On a given day, the grocery list called for an employee to retrieve eighty-six parts from the back wall. Using the following data, we were able to calculate lost time:
Table 1 shows that the number of trips multiplied by the travel time from the assembly line to the back wall results in approximately twenty-six minutes. Determined how much time an assembly worker unnecessarily spent gathering parts from the back wall.
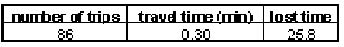
Table 1: Time lost due to walking
Methodology 2: Reorganizing the current storage location of parts
We closely looked at the parts that were being stored on the back wall. They indeed were all large and heavy parts, but used just as frequently as parts that were stored directly on the assembly line. The parts stored on the assembly line were just four feet from the assembly line, while the parts stored on the back wall were forty-two feet away from the assembly line. We also found that many of these heavy parts were stored on the floor, requiring the assembly worker to bend to get the part. It was determined that heavy parts would be stored in the employees power zone. The power zone is defined as the area from the waste of the employee to the shoulders.
Methodology 3: Determining the current storage space utilization
We estimated the percent utilization of each of the eight storage racks by recording how much surface area each shelf used. From the Table 2 below, it is evident that only one of the eight shelves had greater than ninety-percent utilization.
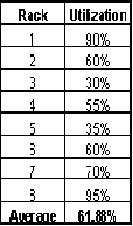
Table 2: Shelf utilization
Upon taking the average of the eight racks, we determined that they were only utilizing sixty-two percent of their space. Thus, thirty-eight percent the remaining space could be used for storing more parts.
Methodology 4: Implementing a rubberized storage system
Because containers come in various shapes and sizes, the appropriate storage container can be determine from the size of the individual parts. Thus size classification is divided into three sections: small, medium and large. We also research the various types of containers.
After researching various storage system companies, it was determined that containers are available in many different shape and sizes, and if a particular shape or size does not exist a company will probably make it for you (depending on the number that you are planning on ordering). Specifically, most our container dimensions and financials are based on Orbis Corporation (because Kenworth�s executives has already made an agreement with Orbis). The dimensions for the small, medium, and large containers (as defined by Orbis) are shown in Table 3 below.
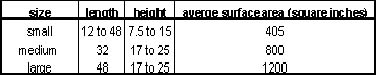
Table 3: Storage container dimensions and surface area
It should be noted that we researched Orbis�s competitors, and we determined that their products are competitive.
Thus, to simplify our calculations we determined the percentage of small, medium and large parts. It should be noted that a parts size classification is based on weight. Specifically, we weighed all of the parts that we research and placed them into a size classification based on the following weighs, which are shown in Table 4. We choose weight as the criterion for basing size classification because all of the parts are made from steel (therefore they all size-weight proportionate).
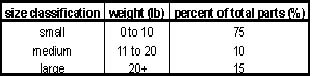
Table 4: Part size classification and percent distribution
From the Table 4, it is also evident that seventy-five percent of the parts are small, ten percent are medium, and fifteen percent are small.
Now that the percentage of parts has been defined, we can determine how many containers we need, and then calculate how many containers will fit on each shelf. This information, combine with which parts need to be stored on each shelf, can be used to find an optimal storage system configuration.
�
Methodology 5: Optimizing the storage system utilization
The utilization calculations show that Kenworth�s shelves are underutilized, but the majority of the under-utilization is in the vertical direction. Currently inventory is being stored in the original manufacture�s packaging. Most of these packages have a large footprint (that is, they are taking up a significant amount of horizontal shelf space). A much more efficient method of storing the inventory is to stack the parts on top of each other, this way they are taking up less horizontal shelf space and more vertical space.
Therefore, if they stack the parts they can fit more containers on the shelves in the horizontal direction, which means that more parts will be readily available to the assembly line workers.
When determining such calculations we looked at surface area of the storage space from the assembly line workers perspective. Throughout the rest of the report this direction and perspective will be referred to as the �available surface area�. Photograph three, which is located in the Appendix, shows the available surface area.
This area was chosen because maximizing the number of different parts that can fit on the shelf will allow the workers to have more parts located closer to them, which will decrease their total travel time and increase the amount of value-added work.
Additionally, we also looked at the shelf height placement. This height is different for each set of shelving. We determined that a shelf height of three feet would be optimal because this placement allows the shelf to be within the power zone, and the maximum number of each size container can fit within three feet.
From these calculations we determined the total available surface area which is 28512 square inches. From this we determined the number each type of container that can fit in this space. This is shown in Table 5 below.
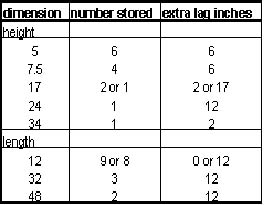
Table 5: The number of containers that can be stored on each shelf
�
It should be noted that all of the dimensions are based on a shelf that is nine feet long.
From this calculation, coupled with the percentage of small, medium and large parts, the number of containers that would need to be purchased to fill the entire area was determined. These calculations are, and the cost for the final purchase is shown below in Table 6.
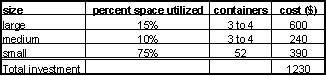
Table 6: Number of containers to purchase and the associate purchase costs
�
Methodology 6: Introducing the �personal tote�
The average worker goes to the fastener storage station and back to chassis five times for each chassis. Assuming the worker attaches approximately five parts per chassis. The distance to the assembly station (fastener storage) is eight feet. Each worker walks approximately two miles per hour. Thus Table 7, which is located below, shows that one hour each day, and $184 a week can be saved.
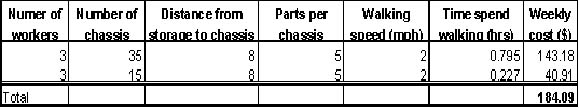 Table 7: Weekly savings incurred
from personal tote implementation
Table 7: Weekly savings incurred
from personal tote implementation
The other issue presenting itself in this process is that the worker often assembles multiple bolt nut combinations at the storage station platform and then brings them to the point of attachment to the chassis. As they attach each individual bolt the other nuts and bolts are stored either on the chassis or on the floor next to chassis. Reaching to get parts off the floor frequently during the day presents an ergonomic issue.
SOLUTION: The Personal Tote
After consulting the area supervisor it was discovered that each worker only uses a maximum of eight nut-bolt combinations. Thus a personal tote would be used to eliminate the walking time and the back strain associated with attaching nuts and bolts to the chassis.
The next issue is how is whether the tote should be attached from the worker or to the chassis, and if the tote should be a horizontal platform. These decisions were weighed in a decision matrix.
THREE DECISION MATRIX IDEAS:
These ideas were weighed against the current method (using no tote) using the following criterion.
CRITERION:
With the following criterion and the appropriate weights, the vertically hanging personal tote scored the highest by a margin of four points. The decision matrix is located in the Appendix.
MATERIAL AND HANGING METHOD:
After the vertical tote was decided as the best solution. The material of the tote was the next decision to be made. Safety, durability, cost, flammability and comfort of use were all equally considered. The two fabrics considered were leather and an industrial canvas. The second decision matrix scored leather the highest. Leather is more durable, comfortable, and fire resistant.
Two methods of hanging the tote from the chassis were also considered. The electromagnetic bar proved itself to be more mob and safe than a tote hanging from the chassis by hooks.
TOTE VERSUS NO TOTE:
The decision matrix shows negligible point differences between using a tote and the current method. The decision matrix was used as supporting logic for the decision of one personal tote versus another. The following is the supporting information for the purchase of the tote. We are assuming each of the personal totes cost Kenworth approximately $60. This is after investigating similar leather utility containers and adding a reasonable cost for customization. Examples of these utility containers are located in the Appendix. With a price of $60 the payback for the installation is less than 2 days.
Table 8, which is located below shows the net savings with the purchase of the personal tote. The saved walking time stems from the assumptions that each worker assembles five parts per chassis, that the parts are currently stored eight feet from the chassis, and that fifty chassis are assembled a day.
|
Recommendation |
Purchase cost ($) |
Saved walking cost per week ($) |
Net yearly savings ($) |
|
Personal tote |
60 |
184.09 |
31022.5 |
Table 8: Net yearly savings incurred from personal tote implementation