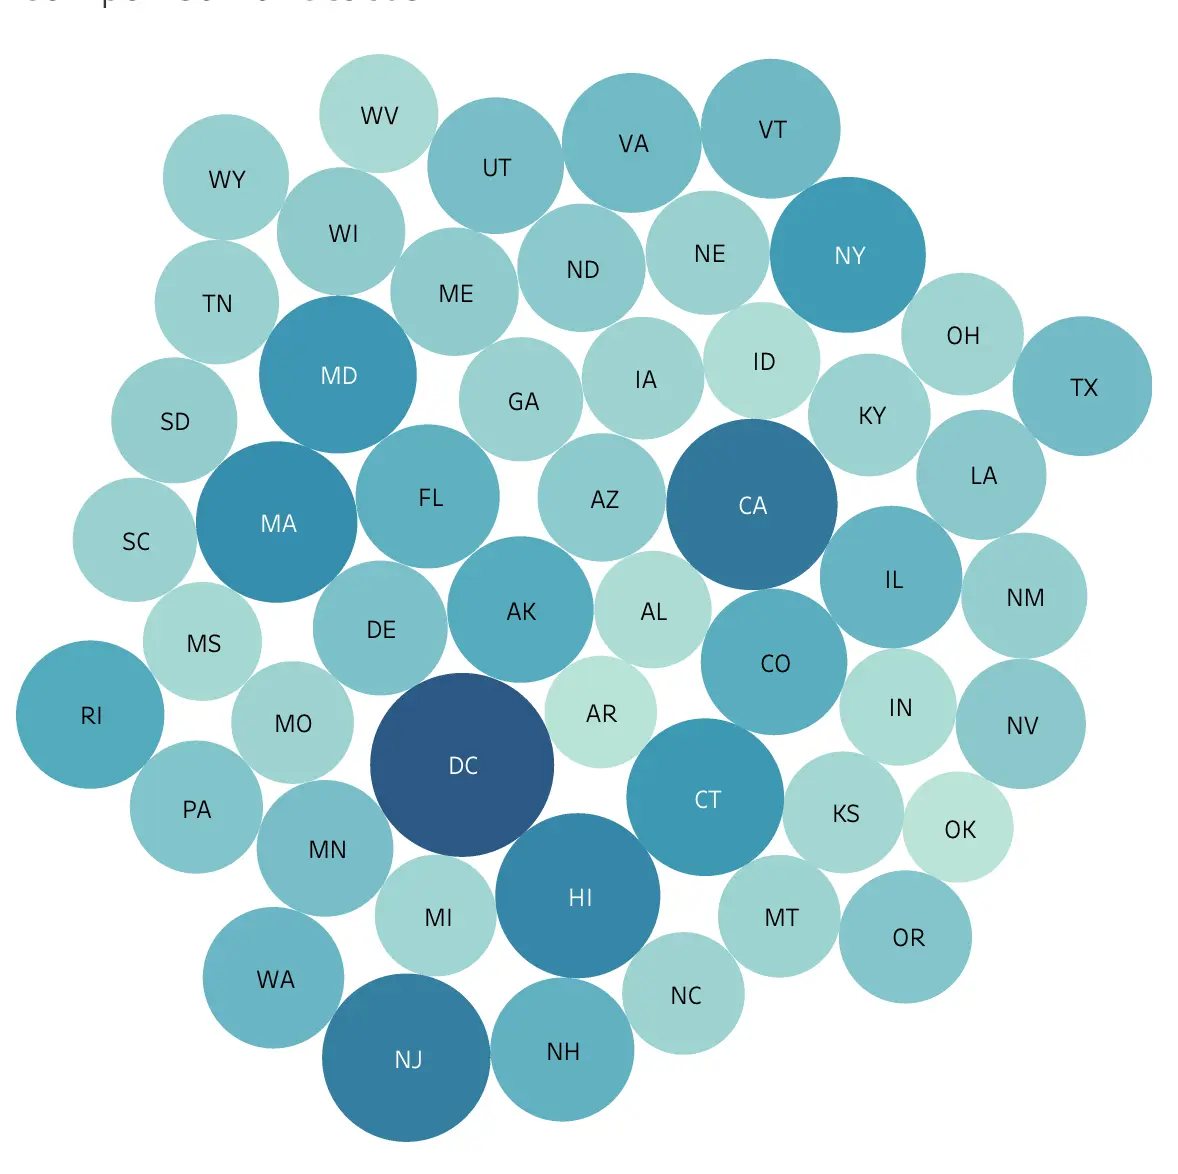
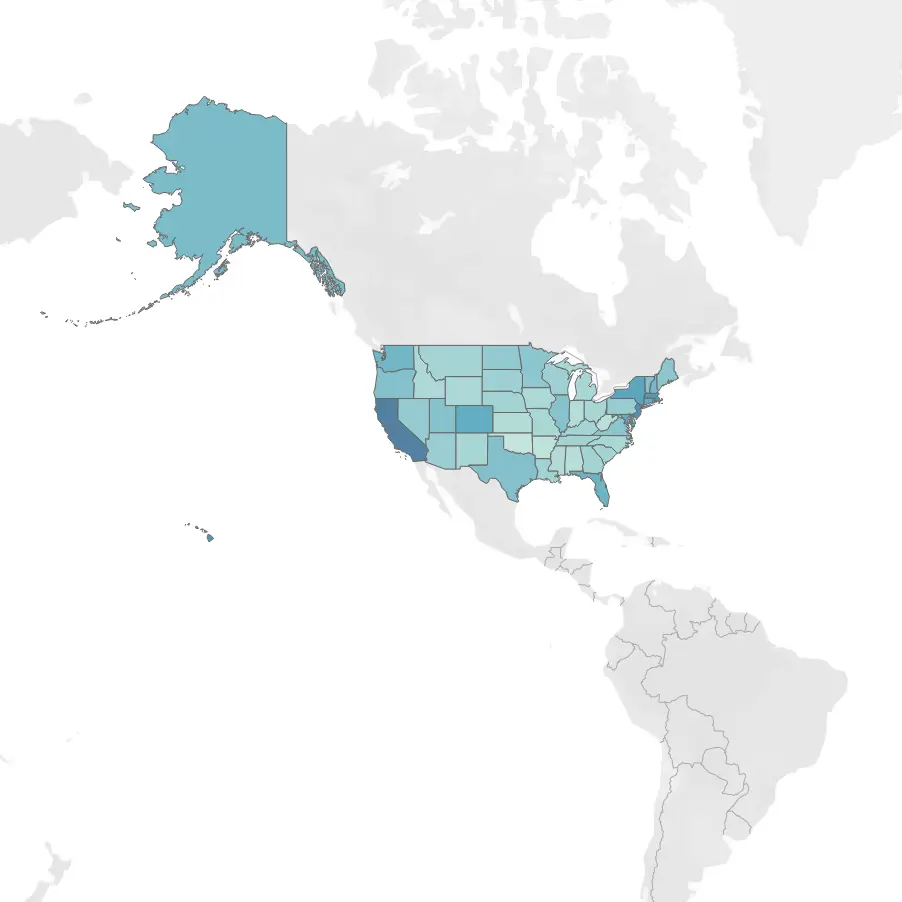
Everyone is familiar with rent. Whether you've paid rent at sometime during your life, or you've rented to someone, knowing the going rate is important. For this project I did an indepth anaylsis on which states had the lowest rent prices. In this visualization the states with the most expensive rates have darker and larger bubbles.

bubble graph
america graph

As a continuation of analyzing rent prices in America. I created an interactive graph that can be filtered on years and counties within states. I also used monthly data to determine the best time to start a lease to get the cheapest rent. February was the best time to start renting to get the lowest monthly rate, but overall each month was similar, so the month you start renting in is not crucial.

oscillating temperatures

The seasonality of weather can have a big impact on results of a model. For this model, I gathered weather data of all countries involved to greater increase the accuracy of my results. The main focus of the model was to understand how the dynamic between mosquitoes and dengue fever. Due to mosquitoes not being able to regulate their own body temperature, they are dependent on outside temperatures to surive, therefore including temperature into the model was crucial.

predicting number of trick-or-treaters

For this project, I used data from past years to determine how many trick-or-treaters would be out in future years. This dataset included times of when trick-or-treaters arrived as well as the day of the week that Halloween fell on. Using this data I was able to understand what days of the week are more likely to have a larger number of children and what could be expected in the future.