 | ||||||
| Articles | Projects | Resume | Cartoons | Windsurfing | Paintings | Album |
The Effects of Pulp Mill Effluent on
Byssal Thread Production by the
Marine Blue Mussel Mytilus edulis
by Waterose

Section 3. Results
3.1 Results of Trial 1 and Revisions for Trial 2:
3.2 Byssal Thread Regeneration in Trial 2:
3.3 Water Quality Abiotic Parameters:
3.4 Byssal Thread Regeneration and Abiotic Water Parameters Combined:
3.5 Statistical Analysis of the Results:
3.1 Results of Trial 1 and Revisions for Trial 2:
The solutions containing the mussels were removed from the cold room after forty-eight hours and the mussels were examined for byssal thread regeneration. The mussels in the control and the other solutions were dead. It appeared that they had smothered in the bacterial growth that occurred due to their spawning action as evidenced by pools of an opaque white substance coagulated around the umbo region. This was observed at the outset of trial 1. Samples of the substance were observed under a microscope and it was confirmed that the opaque white substance was egg and sperm discharge. The ovum and undulating sperm were clearly visible under magnification. Consequently, the methods were revised to compensate for decreased oxygen (O2) and increased wastes in the mussel environment.For trial 2, the beakers with the solutions and the study organisms were stored in the cold room and they were aerated with an electric air pump connected to an air stone in each solution. To ensure that the mussels did not smother in their own waste, two batches of solutions were prepared in advance so that the solutions in the beakers could be changed after twenty-four hours. This facilitated the survival of the test group in trial 2. The collection and use of fresh organisms and sea water at noon on the day of the experimental trial 2 also ensured that the mussels were well fed.
3.2 Byssal Thread Regeneration in Trial 2:
The results of trial 1 did not indicate byssal thread regeneration and are summarised in the Appendix I. The results of trial 2 are summarised in Table 1 below. The mean of the byssal thread regeneration was calculated by dividing the total regeneration in each solution by the number of mussels that survived.Table 1. Mass of Byssal Thread Regeneration by Blue Mussels after forty-eight hours at 8-12 degrees Celsius in Trial 2.
| Solution | Code (See Below) | Mass (g) Boat and Threads | Mass (g) Boat | Mass (g) Threads | Survival No. | Mortality No. | Mass(g) Mean Regen | Observations at 48 hours | Spawning Behavior at 24 hours |
|---|---|---|---|---|---|---|---|---|---|
| Sea Water Control | A | 0.6093 | 0.6050 | 0.0880 | 5 | 0 | 0.01760 | regrowth | Yes-2 |
| Treated Effluent | B | 0.0000 | 0.0000 | 0.0000 | 5 | 0 | 0.00000 | all sealed | No |
| Untreated Effluent Dilution 0 | C | 0.6167 | 0.6156 | 0.0011 | 4 | 1 | 0.00275 | one dead | can't tell |
| Dilution 0.1 | D | 0.6117 | 0.5902 | 0.0215 | 3 | 2 | 0.00717 | two dead | Yes-lots |
| Dilution 0.01 | E | 0.6304 | 0.5973 | 0.0331 | 4 | 1 | 0.00828 | one dead | No |
| Dilution 0.001 | F | 0.6386 | 0.5889 | 0.0497 | 4 | 1 | 0.01240 | one dead | Yes-2 |
| Dilution 0.0001 | G | 0.7142 | 0.6165 | 0.0977 | 5 | 0 | 0.01950 | - | No |
| Dilution 0.00001 | H | 0.6450 | 0.6091 | 0.0359 | 4 | 1 | 0.00898 | one dead | No |
A = Sea Water Control
B = Treated Effluent
C = Pure Untreated Effluent
D = 0.1 Untreated Effluent Dilution
E = 0.01 Untreated Effluent Dilution
F = 0.001 Untreated Effluent Dilution
G = 0.0001 Untreated Effluent Dilution
H = 0.00001 Untreated Effluent Dilution
These codes are applied throughout the report.
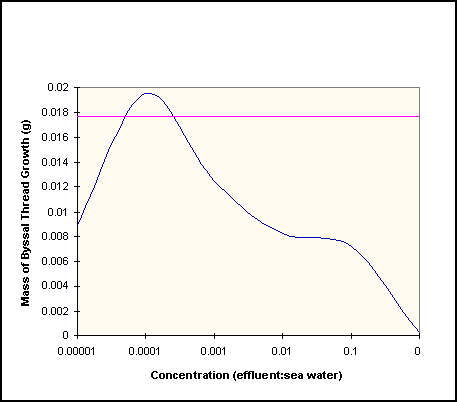
The mean regeneration of byssal threads for mussels in the control was 0.0176 g. The mean regeneration of byssal threads for mussels in the untreated effluent ranged from 0 g to 0.0195 g. The mean regeneration of byssal threads for mussels in the treated effluent was 0. The mean regeneration of the byssal threads for the mussels in the untreated effluent is plotted on the dose-response curve in Figure 2 below. The horizontal line at 0.018 represents the regeneration of byssal threads of the mussels in the sea water control.
3.3 Water Quality Abiotic Parameters:
The physical abiotic water quality parameters for trial 1, and for trial 2, including both sets of solutions (2a and 2b) are summarised in Table 2 below.Table 2. Physical Parameters of Water Quality for Trials 1, and 2.
| Trial No. | Solution Code | pH | Temp Degrees Celsius | Salinity pp/1000 | Conductivity | Mortality No. | Survival No. | Regenerated Mass (g) | Dilution |
|---|---|---|---|---|---|---|---|---|---|
| 1 | A | 8.60 | 16.40 | 22.0 | 20800 | 5 | 0 | 0.000000 | 0 |
| 1 | B | 6.60 | 20.50 | 0.0 | 1510 | 5 | 0 | 0.000000 | 0 |
| 1 | C | 8.90 | 20.50 | 10.0 | 950 | 5 | 0 | 0.000000 | 0 |
| 1 | D | 7.66 | 17.80 | 17.0 | 19600 | 5 | 0 | 0.000000 | 0.1 |
| 1 | E | 8.38 | 17.50 | 21.0 | 21000 | 5 | 0 | 0.000000 | 0.01 |
| 1 | F | 8.13 | 17.50 | 22.0 | 21300 | 5 | 0 | 0.000000 | 0.001 |
| 1 | G | 8.23 | 17.50 | 23.0 | 21200 | 5 | 0 | 0.000000 | 0.0001 |
| 1 | H | 8.04 | 17.50 | 23.0 | 21500 | 5 | 0 | 0.000000 | 0.00001 |
| 2a | A | 8.15 | 16.20 | 25.0 | 23700 | 0 | 5 | 0.017600 | 0 |
| 2a | B | 6.73 | 17.50 | 1.0 | 1520 | 0 | 5 | 0.000000 | 0 |
| 2a | C | 8.73 | 17.10 | 10.0 | 2750 | 1 | 4 | 0.000275 | 0 |
| 2a | D | 7.72 | 17.90 | 22.0 | 190 | 2 | 3 | 0.007170 | 0.1 |
| 2a | E | 8.65 | 17.40 | 24.0 | 24900 | 1 | 4 | 0.008280 | 0.01 |
| 2a | F | 8.74 | 17.30 | 25.0 | 25200 | 1 | 4 | 0.012400 | 0.001 |
| 2a | G | 8.76 | 16.80 | 25.0 | 25200 | 0 | 5 | 0.019500 | 0.0001 |
| 2a | H | 8.79 | 16.60 | 25.0 | 25200 | 1 | 4 | 0.008980 | 0.00001 |
| 2b | A | 8.30 | 13.20 | 26.0 | 16800 | 0 | 5 | 0.017600 | 0 |
| 2b | B | 6.87 | 13.00 | 2.0 | 1180 | 0 | 5 | 0.000000 | 0 |
| 2b | C | 8.56 | 13.10 | 10.0 | 905 | 1 | 4 | 0.000275 | 0 |
| 2b | D | 7.65 | 13.20 | 22.0 | 20800 | 2 | 3 | 0.007170 | 0.1 |
| 2b | E | 8.46 | 13.10 | 24.0 | 22500 | 1 | 4 | 0.008280 | 0.01 |
| 2b | F | 8.53 | 13.20 | 25.5 | 22500 | 1 | 4 | 0.012400 | 0.001 |
| 2b | G | 8.62 | 13.20 | 25.0 | 22500 | 0 | 5 | 0.019500 | 0.0001 |
| 2b | H | 8.68 | 13.20 | 25.0 | 22700 | 1 | 4 | 0.008980 | 0.00001 |
* Solution Codes:
A = Sea Water Control
B = Treated Effluent
C = Pure Untreated Effluent
D = 0.1 Untreated Effluent Dilution
E = 0.01 Untreated Effluent Dilution
F = 0.001 Untreated Effluent Dilution
G = 0.0001 Untreated Effluent Dilution
H = 0.00001 Untreated Effluent Dilution
These codes are applied throughout the report.
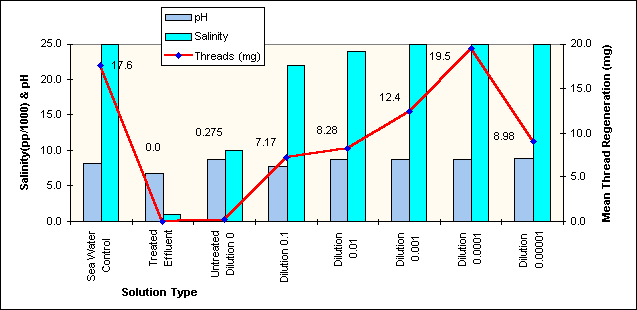
The abiotic parameters for the two sets of solutions for trial 2 do not reflect any significant anomalies between the two solution sets. There is a relationship between conductivity and salinity because conductivity measures the concentration of ions, and salinity is a measure of the ions, primarily Sodium ions, that impart the saline characteristic to sea water. It is important to note the significant differences in the low salinity of the treated effluent solution, and the changes in the salinity of the untreated effluent dilutions which is attributed directly to the amount of salt water in the solution. The pH is relatively stable for all solutions. The water temperature of the solution sets for trial 2 are relatively constant. The abiotic measurements between each trial set of solutions are consistent and do not indicate any significant outliers between sets so there is no evidence of equipment malfunction. For example, the salinity of the treated effluent is consistently between 1-2 ppt for each of the three sets of measurements.
The details of the measurements of the individual organism, the mass of byssal thread regeneration in each beaker solution, the mortality/survival data, and the abiotic water parameters for each set of solutions (Set 1 and Set 2) used in trial 2a, and trial 2b respectively, are itemised in Table 3, and Table 4.
Table 3. Trial 2 Byssal Thread Regeneration and Water Parameters for Set 1 Solutions.
Table 4. Trial 2 Byssal Thread Regeneration and Water Parameters for Set 2 Solutions.
3.4 Byssal Thread Regeneration and Abiotic Water Parameters Combined:
The abiotic parameters for the first set of solutions used in trial 2 including pH, and salinity are plotted below in Figure 2, below, with the mean regeneration of byssal threads which has been converted to units of mg. Conductivity is closely related to salinity and so it has been omitted from the graph. The treated effluent has zero salinity and the untreated effluent has a low salinity of 10 ppt. The pH ranges from pH 6.73 to pH 8.79 .
3.5 Statistical Analysis of the Results:
The statistical analysis of the results was not possible due to the failure of the first trial, and also due to the fact that it was not possible to identify the mass of byssal threads generated by each individual organism.
To Section 4. Discussion:
Index:
- Introduction:
- Procedure:
- Results:
- Discussion:
- Future Study:
- References:
- Appendix I. Trial 1:
- Postscript:


 email Waterose
Please Sign My Guestbook
Please View My Guestbook

| Articles | Projects | Resume | Cartoons | Windsurfing | Paintings | Album |
 | ||||||