MODULE 6
![]()
![]()
![]()
After studying this module, the reader will be able to
On April 21, 1994, the Technical Steering Panel (TSP) of the Hanford Environmental Dose Reconstruction Project released draft reports. These reports contain dose estimates for representative individuals from radioactive materials released to the air and the Columbia River by Hanford operations from 1944 to 1992.
The highest estimated doses were received by people living downwind of Hanford who drank milk from cows grazing on fresh pasture that was contaminated with iodine-131 from air releases during the time period 1944-1947. Most of the iodine-131 consumed by people concentrated in the thyroid gland. Very young children likely received the highest doses. The TSP also released dose estimates for the radionuclides considered to be the most important in the air and river pathways. The five other air pathway radionuclides are strontium-90, ruthenium-103, ruthenium-106, cerium-144 and plutonium-239. The radionuclides important in the river pathway are sodium-24, phosphorus-32, zinc-65, arsenic-76 and neptunium-239 (Technical Steering Panel, 1994).
This module will discuss the process used to estimate Hanford doses and the unique aspects of this project. The results of both the air pathway and the river pathway dose estimates are summarized.
The first part of the Hanford dose reconstruction was to determine the source term. This process reconstructed how much material was produced in the nuclear reactors and transferred to the chemical separations plants. Scientists then estimated how much radioactive material was discharged to the air. The next part of the reconstruction, called transport and deposition, calculated the concentration of the materials in the air. It also tracked the movement of the materials in time and space and determined the amount deposited on the soil and vegetation.
Scientists next determined the amount of environmental accumulation of the radionuclides in grass, milk, vegetables, and other foods. Dose estimates were then made using lifestyle information, such as food consumption rates, for average or typical groups of people. Much of this work was done using computer models. Lifestyle information for Native Americans was not considered in this part of the study but will be included at a later date.
Source term data for the river pathway provided estimates of the amount of radioactive material discharged to the Columbia River. Project scientists used source term estimates for the eight Hanford nuclear reactors operating from January 1950 through January 1971 to estimate the concentrations of key radioactive materials in the Columbia River water. Scientists estimated the concentrations for several downstream locations by simulating radioactive material flow and transport in the river. A computer program simulated transport of the five specific river pathway radionuclides from the Hanford reactors to the mouth of the Columbia River. A simplified model was used to estimate doses for the years 1944-1949. Dose estimates for 1971 to 1992 used data from Hanford annual environmental reports.
Monthly average water concentrations were reconstructed for 12 sections of the Columbia River for the five radionuclides contributing the most to dose. Actual monitoring data were used when available. Where actual monitoring data were limited, radionuclide water concentrations were estimated by using estimates of releases from the reactors along with information about dilution in the river. These water concentrations were used, along with water pathway lifestyle information, to calculate dose estimates for representative individuals.
The information needed to calculate the true dose any one person received does not exist. Actual monitoring data are limited, and the amount of environmental radioactive contamination at any given place and time can only be estimated, not determined. Radiation doses also depend on factors unique to each person, some of which cannot be recalled exactly. As a result, there will be some uncertainty about the true dose that each person actually received. In addition, since the dose estimates are generated by computer models, it is important to validate the models' abilities to predict results.
Uncertainty in dose estimates can be caused by several factors. These include incomplete information, such as not being able to measure all the food people actually ate, and errors made in past measurements of radioactive materials in emissions, the environment, or people. Natural variations also contribute to uncertainty in the input information used in the computer models for doing dose calculations. Examples of these variations include differences among individuals in age, sex, lifestyle, and geographic location; differences among dairy cows in the amounts of contaminated pasture grass they ate; and differences in milk production of individual cows during the year.
Project scientists assessed these factors to determine the level of uncertainty for each. For the release of iodine-131 to the air, for all cases, the factor contributing the most to uncertainty-30 to 70 percent-is the difference in the way a person's body takes up ingested radioactive material. This results from differences such as variations in the size of the thyroid and metabolism. For representative individuals drinking milk from family cows fed fresh pasture, the second most important factor is the difference in the way radioactivity is transferred from the feed to a cow's milk. This contributes 35 to 40 percent of the overall uncertainty.
Scientists validate the accuracy of the computer model used to estimate doses by comparing the computer-estimated concentrations with actual measurements obtained from the field or laboratory. These include measurements of radioactive materials in the environment (vegetation, fish, and Columbia River water) and in Hanford workers and school children; and limited, past dose estimates for the public.
Compilation of a sufficient number of these validations was done to demonstrate the general reliability of the project's dose estimation methods. As a result of the model validation work to date, no revisions to any of the models were recommended by the TSP.
Scientists calculated air pathway dose estimates for people exposed to the radioactive releases during the years 1944 to 1992. The dose estimates are for representative (or typical) individuals who lived in a 75,000 square mile area surrounding Hanford.
Exposures of the thyroid to iodine-131 dominated the doses in the air pathway. Detailed iodine-131 dose estimates were prepared for the years 1944 through 1951 covering 1102 locations. Doses to twelve different kinds of representative individuals, distinguished by age and gender, were estimated for a series of food source scenarios. These dose estimates were presented in a report as a series of maps showing annual or cumulative absorbed dose to the thyroid (Farris, et al. 1994). Figure 1 is a map of the cumulative median thyroid doses of a representative child with the maximum exposure from all air exposure pathways for the years 1944 through 1951 when the iodine-131 releases were the highest.
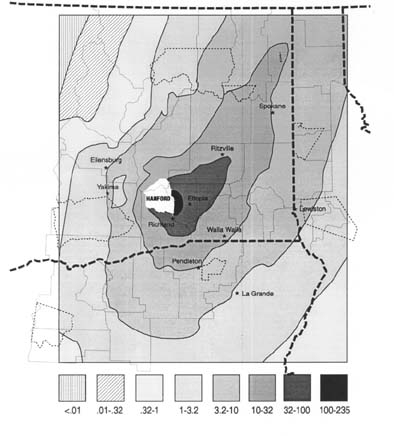
To use the map, locate the area of interest, note the shading, and in the key find the dose range that corresponds to the shading. For each shaded area, there is a range of median doses in the key. The maximally-exposed representative individual is estimated to have been a child at Ringold, Washington, born in 1944 and remaining at that location through 1951. The median dose for this maximally-exposed child is 240 rad, with a dose range of 54 rad to 870 rad.
The cumulative thyroid doses calculated for downwind areas near Hanford were larger than those more distant from the site. Table 1 shows doses for a maximally-exposed child in other locations.
Doses also vary with age and sex due to different diets and different metabolism of materials in the body. In general, doses are somewhat higher in males than females and go down as age progresses for individuals with the same location and diet pattern. The source of a person's milk has a large impact on doses.
Persons drinking milk from cows that grazed on fresh pasture generally have the highest doses, whereas those drinking milk from cows that ate stored feed have lower doses. Commercial milk yielded lower doses than backyard cows as a result of partial decay of iodine-131 during processing and distribution or when milk produced in different locations was combined. Generally, people who drank commercial milk have an estimated dose lower than the dose to persons who drank milk from cows fed solely on fresh pasture and higher than the dose to persons drinking milk from cows fed solely on stored feed.
When milk is not a part of a person's diet, the major contributor to dose is the consumption of fresh leafy vegetables. The doses from fresh leafy vegetables are much smaller than those from milk.
The annual and cumulative doses for a representative adult from 1945-1972 for five other important radionuclides were calculated. However, iodine-131 was the dominant radioactive material contributing to dose during all of the 1940s and 1950s. In 1945, iodine-131 exposure was responsible for 99.8 percent of the dose to an adult in Richland, Washington, if that person drank fresh milk from a cow on pasture. Plutonium-239 and cerium-144 were the next largest contributors at about 0.1 percent of the total dose each.
| Location | Median Dose | Dose Range |
| Ringold | 235 rad | 54 rad to 870 rad |
| Richland | 93 rad | 24 rad to 350 rad |
| Eltopia | 73 rad | 19 rad to 300 rad |
| Ritzville | 28 rad | 7.4 rad to 120 rad |
| Walla Walla | 13 rad | 3.7 rad to 44 rad |
| Spokane | 11 rad | 2.8 rad to 44 rad |
| Pendleton | 8.6 rad | 2 rad to 30 rad |
| Lewiston | 4 rad | 1 rad to 15 rad |
| Yakima | 2.8 rad. | 66 rad to 9.6 rad |
| Ellensburg | 2.1 rad. | 52 rad to 6.7 rad |
By 1965, iodine-131 releases had decreased to the point where cerium-144 became the dominant contributor to dose and was dominant for the remainder of the time period examined. Nevertheless, over the entire period of 1945 to 1972, iodine-131 was by far the dominant radioactive material contributing to dose at 98.8 percent.
These dose estimates may change somewhat as the work of the dose reconstruction project continues. Additional study of plutonium and ruthenium particles released from the stacks of two Hanford plants is planned.
Estimating one's dose from historical Hanford operations is one area of interest. Many people ask what these doses mean to their health. One method of putting radiation doses to the thyroid in perspective is to compare doses from Hanford's releases to medical diagnostic procedures. In the past, doctors used iodine-131 in nuclear medicine tests to see whether the thyroid was functioning properly. In this procedure, the thyroid typically received a radiation dose of 50 to 100 rad.
A retrospective cohort study by Holm et al [1988] investigated the incidence of thyroid cancer in people examined with diagnostic doses of iodine-131. The researchers concluded there was little evidence that iodine-131 is carcinogenic in humans at diagnostic doses. In a critique of this study, Gofman [1990] disagrees. His analysis of study data indicated an excess of thyroid cancer. One of the reasons for the differing analyses is that the Holm study excluded thyroid diseases diagnosed during the first five years after initial administration of iodine-131. This was done to account for the possibility of cancer being present but undiagnosed at the time of testing and not detected clinically until some years later. Gofman's analysis of the data includes thyroid diseases diagnosed within the first five years after administration of iodine-131.
Studies of low-dose exposures are necessary to further knowledge about the effects of iodine-131. Results of the Hanford Thyroid Disease Study may provide specific information about the risk of thyroid disease among people exposed to Hanford's radioactive releases.
The doses from the other air pathway radionuclides were typically in the low millirem EDE to fractions of a millirem EDE range (for an explanation of EDE, please see "Radiation Dose Units"). It is difficult to say much about the health effects of these radionuclides as there are few studies of internal exposure at low-dose levels. However, most scientists agree that any radiation exposure has a potential for causing health effects, such as cancer.
The highest radiation doses received by people from the Columbia River pathway were generally much smaller than the highest doses from the air pathway. There are many reasons for this. Two are most important. First, many radioactive elements which were released to the river have short half-lives. Since it often takes longer for materials to reach people by water than by air, more of the radioactivity will have decayed by the time people come in contact with the radioactivity. Second, concentrations of radioactive material in drinking water or fish were likely much lower than concentrations in cow's milk or leafy vegetables.
Detailed dose estimates for the time period of the largest releases, 1950-1971, were calculated on a monthly basis for three types of individuals for 12 sections of the Columbia River. The doses were highest during this time period because the radioactive releases were at their peak. Doses were calculated for a "maximum representative individual," a "typical representative individual," and an "occupational representative individual."
The "maximum" individual ate three meals of resident fish per week, drank treated Columbia River water, and spent some recreational time on or near the river. The "occupational" individual spent an average of more than 55 hours per week on or in the river and drank only untreated river water. This individual ingested some salmon and shellfish but no resident fish. The "typical" individual, based on historical surveys, did not eat resident fish or consume large quantities of untreated river water.
Table 2 shows median doses for each of these representative individuals for 12 sections of the river. Doses are shown for three periods (1944-49, 1950-71, and 1972-92) and cumulatively for 1944-92. These EDE doses summarize doses from all radiation sources in an equivalent way.
| Location | 1944-49 | 1950-71 | 1972-92 | Total (1944-92) | ||||||||
|---|---|---|---|---|---|---|---|---|---|---|---|---|
| M | T | O | M | T | O | M | T | O | M | T | O | |
| Ringold | 103 | 8 | 32 | 1421 | 51 | 519 | 7 | 4 | 7 | 1531 | 63 | 558 |
| Richland | 100 | 7 | 27 | 1393 | 29 | 908 | 7 | 4 | 7 | 1500 | 40 | 942 |
| Kennewick/Pasco | 91 | 6 | 22 | 1297 | 63 | 507 | 7 | 4 | 7 | 1395 | 73 | 536 |
| Snake/Walla Walla | 60 | 4 | 14 | 881 | 44 | 290 | 4 | 3 | 4 | 945 | 51 | 308 |
| Umatilla/Boardman | 59 | 3 | 10 | 709 | 26 | 101 | 4 | 3 | 4 | 772 | 32 | 115 |
| Arlington | 53 | 3 | 8 | 683 | 24 | 87 | 4 | 3 | 4 | 740 | 30 | 99 |
| John Day/Biggs | 52 | 3 | 7 | 667 | 23 | 79 | 4 | 3 | 4 | 723 | 29 | 90 |
| Deschutes River | 49 | 3 | 7 | 629 | 22 | 73 | 4 | 2 | 4 | 682 | 27 | 84 |
| The Dalles/Celilo | 48 | 2 | 6 | 618 | 21 | 70 | 4 | 2 | 4 | 670 | 25 | 80 |
| Klickitat River | 46 | 2 | 5 | 597 | 20 | 64 | 4 | 2 | 4 | 647 | 24 | 73 |
| Cascade Locks | 44 | 2 | 4 | 575 | 19 | 58 | 4 | 2 | 4 | 623 | 23 | 66 |
| Lower River | 36 | 1 | 3 | 456 | 15 | 41 | 3 | 2 | 3 | 495 | 18 | 47 |
Scientists measure radiation in dose units. These dose units help assess and describe the potential damage to body tissues by radiation.
One key unit is a rad. This unit of dose describes how much energy body tissues absorb during an exposure. The radiation dose it describes is called "absorbed dose."
However, equal absorbed doses of different types of radiation may not produce equal effects on the body. An absorbed dose of alpha particles is more damaging than the same absorbed dose of gamma rays or beta particles. To account for this difference, a unit of dose called "dose equivalent" is used. Its unit of measurement is the rem.
To determine the dose equivalent, absorbed dose must first be calculated. Absorbed dose is then multiplied by a radiation weighting factor depending on the type of radiation. The radiation weighting factor for alpha particles is 20. To calculate the dose equivalent for an exposure to alpha particles, the dose in rad is multiplied by 20 to give the dose equivalent in rem. For gamma rays and/or beta particles, the radiation weighting factor is one. In this case, 1 rad is equal to 1 rem.
Another factor is important in evaluating radiation exposure. Different parts of the body respond differently to the same dose of radiation as some body cells are more sensitive to radiation than others. In some cells, radiation is more likely to cause late effects, such as cancer, or genetic changes.
The same radiation dose has different impacts on different parts of the body. To account for these variations, individual tissues are given weighting factors which take into consideration the level of impact of a given radiation dose on a tissue of interest. Parameters that were taken into account in developing the weighting factors include the probability that radiation will induce a particular type of cancer or genetic effect, the probability that the cancer or effect will be lethal, and the years of life that will be lost as a result of the death. These tissue weighting factors are as follows:
It can be implied, for example, that the gonads, with a weighting factor of 0.25, are more than twice as likely to suffer a health impact from the same dose than the red bone marrow or the lung.
If all of these weighting factors are added up for the 12 tissues, the total comes to 1.00. This allows a uniform comparison of the impact of the irradiation of an individual tissue to that of the irradiation of the whole body.
Another special dose is called effective dose equivalent (EDE). It is used when weighting factors are taken into consideration. The name-effective dose equivalent-is appropriate since it states that it is not only the dose that is taken into consideration but also the effect or the impact on the tissue of interest. The unit of effective dose equivalent is also the rem and is often called the rem EDE.
To use this approach, one must calculate the absorbed dose (rad) and then convert it to dose equivalent (rem). Assume that the absorbed dose calculated to the thyroid for an individual exposed to iodine-131 is 100 mrad. The dose equivalent is 100 mrad multiplied by the radiation weighting factor for iodine-131, a beta emitter, which is one. This is then multiplied by the tissue weighting factor for the thyroid of 0.03 to give the effective dose equivalent.
This can be interpreted by saying that the expected health impact on an individual of an absorbed dose to the thyroid of 100 mrad is about 1/30th of what it would be if the whole body received an absorbed dose of 100 mrad.
If a number of organs or tissues are irradiated, their contribution to the effective dose can be added up to produce the total effective dose equivalent. For example, assume the thyroid receives 100 mrem, the lungs receive 200 mrem, and the gonads receive 10 mrem:
Farris WT, Napier BA, Ikenberry TA, Simpson JC,. Shipler DB. Atmospheric Pathway Dosimetry Report, 1944-1992. HEDR, Battelle, Pacific Northwest Laboratory, Richland, Washington. 1994: PNWD-2228.
Farris WT, Napier BA, Ikenberry TA, Simpson JC, Shipler DB. Columbia River Pathway Dosimetry Report, 1944-1992 HEDR, Battelle, Pacific Northwest Laboratory, Richland, Washington. 1994: PNWD-2227.
Gofman J. Radiation-Induced Cancer from Low-Dose Exposure: An Independent Analysis. San Francisco: Committee for Nuclear Responsibility. 1990.
Holm LE, et al. Thyroid Cancer after Diagnostic Doses of Iodine-131: A Retrospective Cohort Study, Journal of the National Cancer Institute. 1988; 80(14): 1132-1138.
Technical Steering Panel. Representative Hanford Radiation Dose Estimates. Washington Department of Ecology, Nuclear Waste Program, P.O. Box 4761, Olympia, WA 98504-7651. 1994.
![]()
![]()