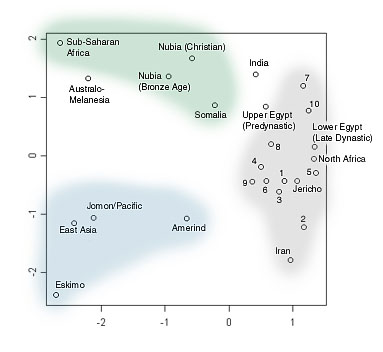
2D, 3D plots were generated from Mahalanobis distances (sqrt D2)
based on 24 cranial measurements from 25 world population samples. The D2 matrix is given in Brace et al., p. 24.
Multidimensional scaling (MDS) is a statistical technique designed to
express graphically, in a small-dimensional space, degrees of similarity or
dissimilarity between objects. Points representing similar objects
tend to cluster together in a specific region of the space; points
representing dissimilar objects tend to be far apart.
Although human variation is actually a continuum and does not conform
to discrete packages, coloring is included to show the traditional
concept of the "great races": green = "Negroid" (main bulk of Africa); gray =
"Caucasoid" (West Eurasia, North Africa); blue =
"Mongoloid" (East Eurasia, America).
"Sub-Saharan Africa" denotes a combined sample from West Africa (Dogon), Congo region (Dahomey), and southern East
Africa (Zanzibar, Daya of Tanzania). If plotted separately, these
would form a cluster of points centered around the sub-Saharan Africa point.
Ancient Egyptian samples: (1) Naqada, predynastic; (2) Giza,
dynasties 26-30