Design Tools

Design tools are used to depict or describe the structure of the system. Commonly used design tools are:
Structure chart: The major tool used in Structured Design to depict the structure of the system is the structure chart. 
Structure charts are graphical descriptions that show the interaction between modules and how the information is passed from one module to another. 
The structure chart shows the external functions, inputs and outputs rather than their internal procedures of data. 
The main difference between a DFD[data flow diagram]  and a structure chart is that a structure chart shows hierarchy within a module.

Components of a Structure Chart


back to top

1.The Module
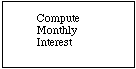
A module is a set of instructions, which can be invoked by name. Modules are represented by rectangles or boxes that include the name of the module. The name of the module summarizes what a module does. The highest level module is called the system, root, or executive module. It calls the modules directly beneath it which in turn call the modules beneath them. 

Example:" Calculate Interest" is the name of the module in which interest will be calculated.

Shown as a rectangular box with its name inside:
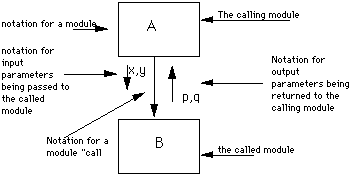
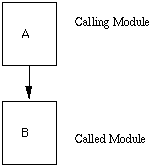


2.Arrow
Arrow represent connection. Arrow indicates that one module is calling another module and the direction of the arrow is from the calling module to called module.

  • Represented by an arrow showing a module call:
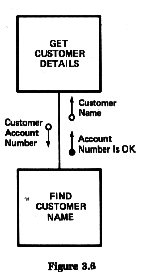


3.Data Couple
A data couple indicates that a data field is passed from one module to another for operation and is depicted by an arrow with an empty circle at the end. 


4.Control Flag
Control Flag assist in the control of processing by indicating the occurrence of specialized condition such as record not existing or reaching the end of the file. 


back to top

5.Loop
Loop indicates that the statements found beneath the symbol are to be repeated a certain no. of times.

diagram


Example of Structure chart:


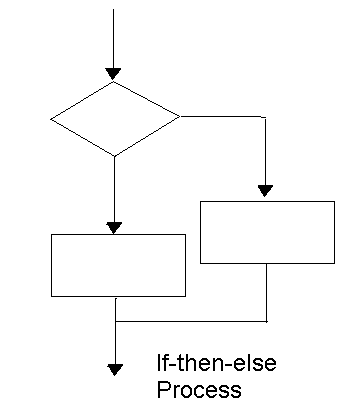
Difference between Structure chart and Flow chart


STRUCTURE CHART
It has no decision boxes.
The sequential ordering of tasks can be omitted.
A structure chart shows hierarchy within a module.
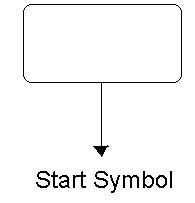
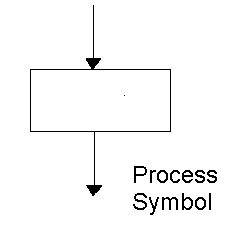
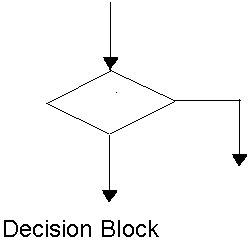
FLOW CHART
It has decision boxes.
The sequential ordering of tasks is essential.
It does not shows a hierarchy.

 back to top

 
Structured English: It is a a way to represent the precise logic of a procedure by writing out that logic using a few limited forms such as sequence, iteration, and selection using if-then or if-then-else formats.

Sometimes known also as pseudocode.
It is easy to understand. 

Example 1:

Retrieve the purchase order
For each item on the purchase order


if quantity received = quantity ordered
then item code is 'match'


If item code = 'match' for all items in the purchase order


then purchase order receipt code is "match"


If purchase order receipt is "match"


then approve payment for order
else return material received 

back to top


Example 2:
For each MEMBER ID in the MEMBERS file repeat the steps below
If RETURN DATE is greater than DUE DATE
Calculate FINE for the number of extra days
print the Fine Bill


Structure Flowchart: Flowcharts are the conventional tool to specify and document sequence of steps carried out to solve a problem. Flowcharts make use of rectangular boxes, arrows, and diamond shaped boxes to depict various elements such as input/output,process,decision and the like.

Start block:
The Start block represents the beginning of the process. It has only one out put and never more than one input.


End block:
The End block represents the end of a process. It has one output and will contain either End or Return depending upon its function. 


back to top


Process block:
A Process block represents some operation carried out on an element of data. A process always has exactly one input and one output.


Decision block:
A Decision block is used to represent an if-else decision statement. It can has only two outputs-Yes or No.


Sequential Process:
The Sequence process is a series of processes carried out one after the other.
If -Then-Else Process:
The If-then-else process logically completes the decision block by providing two separate processes, one of which will be carried out eventually.


Example of Flow chart:


back to top

Hosted by www.Geocities.ws

1