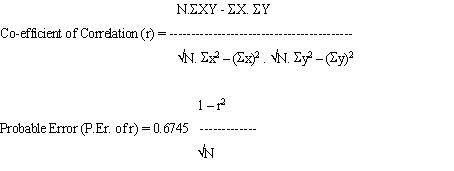
| 6. MATERIALS AND METHODS For the present investigation the fieldwork was conducted from November 1994 to October 1995. To meet the aims and objectives the following materials and methods were used. 6.1 LIMITATIONS OF THE STUDY A regular sampling of fishes was carried out monthly for a period of one year (November 1994 to October 1995) from the stations II, III, IV and V. But fishes were sampled tri-monthly during the study period at station I due to the inaccessibility to the station, lack of transportation facilities, limited working time in the field and unavailability of fishermen. No feasibility study was performed in the Tinau River regarding their environmental impact assessment before and after the establishment of the dam so that the present comparative study became difficult. Although other methods as described in materials and methods were inserted for the study. 6.2 SOURCE OF DATA COLLECTION The primary or basic source of data is based on the direct field observation, information sampling and photography. The data on hydrology and meteorology needed for the present study were procured by the Department of Hydrology and meteorology HMG/N. Questionnaires were preferred to collect the information regarding changing pattern of the river with fish distribution, general environment of the river like the lowering of river water level, severe land erosion, siltation, severe flood etc. Monthly visits were conducted to study the fishing implements and methods used in the Tinau River as well as socio-economic status of the local fishermen. The fishes were collected from Damkada (Mariphant), Charchare, Dovan, Butwal and Bethari (Map No. 3) by employing local fishermen which might represent the average fish abundance and distribution pattern in the Tinau River. However, fishes were also collected from the local markets. The place between Charchare and Butwal is most important from fisheries point of vies (specially for hill stream fishes) because it is provided with gravels, pebbles and boulders on the riverbanks which provide the spawning ground for different types of fishes. The habitat condition like the spawning ground, shelter, and characteristic features of riverbed has been recorded during the field trips. Various kinds of locally prepared fishing nets were used for fish sampling, e.g., cast nets were used for sampling different size of fishes. Scoop nets were used for capturing larvae, fingerlings and small fishes. To collect fishes from deep pools, hook lines were used. The morphometric characteristics and measurement of all the collected fishes were noted in the field itself. The quantitative and qualitative assessments of fish catch were also done. All the collected fishes were carefully preserved in 4-8 percent of formaldehyde, however longitudinal incision along the abdomen was made for larger specimens. The preserved specimens were brought to the laboratory of the Central Department of Zoology for identification and further investigation. These collected fish samples were identified after Shrestha (1981), Shrivastava (1968) and Jayaram (1981). 6.3 ANALYSIS OF PHYSICAL PARAMETERS Physical properties of water in any aquatic system are largely regulated by the existing meteorological conditions and chemical properties. Some of the physical properties of the Tinau River were analysed during the present study period after APHA (1976), Adoni (1985) and Trivedy and Goel (1986). The main physical parameters studied are as follows: 6.3.1 Water Colour Simple method was used to determine the colour of water in the Tinau River. A beaker of water from the river water was taken out and placed on a white paper and the colour was obtained. 6.3.2 Water Velocity The velocity of the river water was measured monthly during the study period. A distance of ten meter was measured on a river section and marked. The current velocity of water was measured and calculated from different stations by simple method of timing a float with watch 8Adoni et al., 1985). 6.3.3 Temperature The air and water temperatures were recorded by using a standard mercury thermometer graduated to an accuracy of 0.5 oC. the air temperature was recorded simply by holding the thermometer in the air while the water temperature was recorded by dipping the bulb of thermometer inside the water surface avoiding the direct sunlight. 6.3.4 Transparency The transparency was measured by using a transparency meter which is based on Secchi disc method. The Secchi disc is a metallic plate of 20 cm diameter with four (alternate black and white) quadrants on the upper surface and hook in the centre to tie a graduated rope. The Secchi disc was lowered in the pool region of the river water and the depth was noted at which it just disappeared. Then the disc was slowly raised upward to note the depth at which it reappeared. The calculation was done by applying the following formula. Just disappearance + just reappearance Transparency (cm) = -------------------------------------------------------- 2 6.3.5 Turbidity Turbidity of the river water is inversely proportional to the transparency. Therefore, the turbidity of the river water was calculated by using transparency value into the following equation. 1000 Turbidity (X) = ------------------------------------- 1.568 Y � 1.275 Where, X = turbidity, and Y = transparency. 6.4 CHEMICAL ANALYSI OF WATER Water samples were collected monthly from every stations of Tinau River during the study period. The water samples were taken directly from the surface water in the polythene bottles. The main following chemical analyses were carried out using the standard methods of APHA (1976), Adoni (1985) and Trivedy and Goel (1986). 6.4.1 Hydrogen ion Concentration (pH) A battery operated electrical pH meter was used to record the pH of water during the study period at every station in the Tinau River. 6.4.2 Dissolved Oxygen Modified Winkler�s method was used to determine the dissolved oxygen which was originally developed by Winkler in 1888. Water samples were collected in a BOD (300 ml) without bubbling. Then 2 ml of manganous sulphate and 2 ml of alkaline iodide-azide solution were added and were shaken well. Thus obtained brown ppt was dissolved by adding 2 ml of concentrated sulphuric acid in the laboratory. Then this sample solution was titrated against standard sodium thiosulphate solution (0.025 N) and the calculation was done by using the following formula. ml x normality of titrant x 8 x 1000 D.O. (mg/l) = ------------------------------------------- V2 {(V1-V)/V1} Where, V = Volume of MNSO4 and KI added, V1 = Volume of BOD bottle, and V2 = Volume of the part of the content titrated. 6.4.3 Total Alkalinity 0.5 ml of methyl red bromo-cresol green indicator was added to the 50 ml of sample water in a conical flask. Then it was titrated against standard sulphuric acid solution up to the end point. Calculation for total alkalinity was done by applying the following formula. ml x normality of H2SO4 x 50.05 x 1000 Total alkalinity (mg/l) as CaCO3 = ------------------------------------------------------------- ml of sample used 6.4.4 Total Hardness The total hardness of river water was estimated by EDTA titrimetric method. 50 ml of sample water was taken in a conical flask. 2 ml of ammonia buffer solution and 200 mg of EBT indicator was added to the sample solution till wine red colour appeared. This solution was titrated against standard EDTA solution (0.01 N) until a clear blue colour appeared. Calculation of total hardness was done using the following formula. ml of EDTA used x 1000 Total hardness = -------------------------------------- ml of sample used 6.4.5 Free Carbon dioxide For the determination of free carbon dioxide, 50 ml of sample water was taken in a conical flask and 2 drops of phenolphthalein indicator were added to it. The colourless solution indicated the presence of free carbon dioxide. This solution was titrated against standard alkali titrant (Sodium hydroxide 0.02272 N) to the slight pink end point. Calculation for free carbon dioxide was done by using the following formula. ml x normality of NaOH x 44 x 1000 Free CO2 (mg/l) = --------------------------------------------------- ml of sample used 6.5 BIOLOGICAL PARAMETERS The biological parameters are mainly planktons which are the free floating and drifting microscopic organisms having neutral buoyance capacity. The planktons are mainly of two types, viz., plant forms called phytoplankton and animal forms called zooplanktons. The samples were collected in 10 ml plastic tubes by using plankton net (30 No. Bolting silk cloth) from the surface water of the bank of Tinau river, once in a month from each stations, for a period of one year (November 1994 to October 1995). Both types of planktons, i.e., phytoplankton and zooplanktons, were preserved in dilute formaldehyde solution in separate bottles. The qualitative analyses was done by placing a drop of concentrated sample on a glass slide and covered with a cover slip. This glass slide with sample was placed under 150X magnification of compound microscope and binocular. The identification of both types of planktons to the genus level was done after Edmondson (1959), Needham and Needham (1962), Masuda and Pradhan (1988), and Adoni (1985). 6.6 STATISTICAL ANALYSIS OF ICHTYOFAUNA The co-efficient of correlation between some important physico-chemical parameters of water with composition of fish species in different months in Tinau River has been calculated by using Karl-Pearson�s method (Gupta, 1988). Probable error is useful in interpreting Karl-Pearson�s Coefficient of Correlation. |
 |
| Home | Family | Curriculum | Thesis TU | Thesis NLH | Publications | Term Papers | Recent Paper | Proposal | Nepali Poems |
| You are here: Home>>>MSc Thesis TU>>>Methodology |