Trade with an Edge
Harmonic Trading Entry Criteria and Risk Criteria
This is about the trading entry criteria I consider when trading.
Over 400 harmonic patterns occur every day. But they are not all good quality patterns. It's importsant to distinguish between the good quality patterns and the not-so-good quality patterns.
It's exactly the same with Supply/demand zones. It's important to distinguish the good from the not so good.
Finally, you need to decide how heavy or light (how many lots) - how much risk - to put on.
The key is ..
Knowing When to Trade - and How Much to Trade
This trading tip is all about how to increase your chances of getting into a good trade, (keeping out of low probability trades) - and also how to know when to use maximum risk (more lots) for more profits - or to reduce risk and trade lighter when required.
As usual the ideas here are based on what I do in my trading.
Enhancing Your Trading Probabilities
There are three main types of trade entry criteria (think of them as "probability enhancers") that I use when considering a trade:
- Primary - Trade Entry criteria - tells me if I should even enter the trade in the first place
- Secondary - Trade Weighting criteria - tells me if I should trade light or heavy
- The 7 Deadly Sins - 7 reminders of when to keep out of the market
The criteria are all on this Trade log/Planner which I use to plan my trade ... before I enter the trade. It helps to keep me focussed and objective when I'm deciding to make a trade or not - and also when figuring out how heavy or light to trade.
Explanation of the 3 criteria ...
Trade Entry (Primary) criteria
All of these 4 primary criteria must be met before I place a trade. If 1 or more of the criteria are not met - then its a showstopper - "NO TRADE".
RvR (Risk vs Reward) - or Risk/Reward Ratio. This criteria requires an RvR of 1:2. See About Risk/Reward for details on how to determine the RvR.
As well as an RvR of 1:2, I want to be able to see 50 pips between average entry level and my first target.
I do not specify Timeframes to trade in my trade plan - but the 50-pip criteria usually excludes anything below 15M - and many 15m patterns too. A 50 pip target can afford a 25 pip stop loss, when using an RvR of 1:2.
Supply/Demand - The PRZ of a harmonic pattern must be in or near a Supply/Demand zone (or Support/Resistance area). Personally I prefer to use Supply/Demand zones - they are less subjective than Support/Resistance Areas. (See Sam Seiden videos on fxstreet.com for a detailed explanation of Supply/Demand trading.)
In my view, Supply/Demand (S/D) zones trump a harmonic pattern PRZ. (Ever seen a harmonic pattern fail as price goes through the PRZ - only for price to reverse a few pips later? Chances are there was a Supply/Demand zone at the actual reversal level just outside the PRZ).
I use the Supply/Demand zone to guide my decision about where stops and entry levels should be.
Higher TF (TimeFrame) Supply/Demand - As above, but for the next higher timeframe. Price is more likely to reverse at a supply/demand area on the higher timeframes. So if we are trading pattern on H1, then we want to be at a supply/demand zone on the h4 timeframe - and, of course, even better if also at supply/demand zone on daily. If we are trading h4 then we want to be at a supply/demand zone on the daily timeframe etc.
RSI PR,NR or multiple PD, ND?
I usually use RSI here - but Stochastics, MACD or CCI can also be used for the same - all depends on personal preference.
Before I enter a trade, there must be a reversal or divergence signal on RSI. Reversals can be bearish (Negative Reversal - NR) or bullish (Positive Reversal - PR). Divergence can also be bearish (Negative Divergence - ND) or bullish (Positive Divergence - PD). At trend turning points you can often see multiple divergence (ND or PD) signals.
You can learn more about these RSi signals at www.youlearnforex.com.
In summary then, as a minimum, I look for trades which offer at least 1:2 Risk/Reward Ratio - and where an RSI signal appears at a Supply/Demand zone, which itself, is aligned with a Supply/demand zone on a higher timeframe.
It is not mandatory (for me anyway) for there to be a harmonic pattern - I am quite happy to take a trade if the above criteria are all met - although without a harmonic pattern I would take less risk and trade it lighter.
Trade Weighting (Secondary) criteria
These checks are all about enhancing the probability of the trade. None of these criteria are show-stoppers. They are used to determine how heavy or light the position should traded.
Probability is reduced when one or more of the above criteria are not met - and so I would trade it lighter. For me that means risking not more than 0.5% of my equity.
Probability is higher when all criteria are met - so a heavier trade is ok. For me, that means risking up to 1% of my equity.
That's just the way I work my trade risk profile - you may wish to do something different.
With Bias - (pattern complies with overall bias)
We always want to Buy-low and Sell high.
In order to do that, I want to determine the "bias" - which basically is the answer to the question - Is it better to be long or short here?
Take a look at the charts below. The first chart is the h4 GBPJPY. So would you rather be long or short?
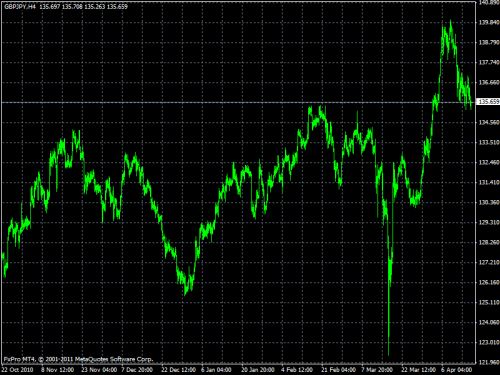
I want to sell high. So, simply by just looking at this chart, I would prefer to be short on this timeframe (H4). The bias on this timeframe is bearish. Therefore, I would look for bearish harmonic patterns to trade.
I may have to wait for price to move up again before I can find a suitable bearish pattern - but it would be worth waiting for.
TF above bias? (higher timeframe bias)
Now take a look at the next higher Timeframe (daily GBPJPY). Would you rather be long or short?
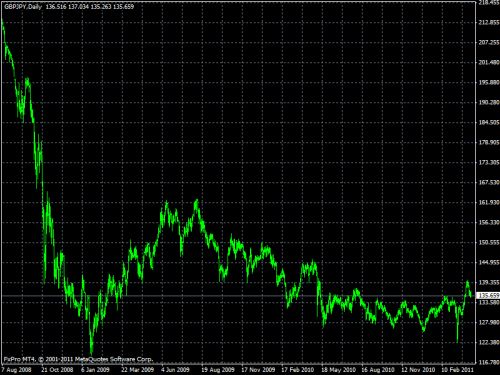
I want to buy low. So I would wait for bullish harmonics on the daily timeframe.
The bias on the daily timeframe is bullish.
When there is bias conflict - trade it lighter
In this example, there is clearly a conflict between the H4 and Daily timeframes on GBPJPY in terms of bias here. That must lower the probability of the H4 trade working out.
So, although I would trade a valid bearish pattern, if one appeared, on the H4 chart, that met the 4 primary criteria - the bias conflict with the daily chart means I would trade a lighter position.
Harmonic Pattern
You may wonder why this is only a secondary criteria and not a primary one. I put a lot more weight on Supply/Demand zones (identifying price imbalance areas) together with RSI (a measure of momentum) to tell me where price reversals are likely to happen than on harmonic patterns. But if there is a harmonic pattern at a supply/demand zone - I take that as a sign of even higher probability and I am more comfortable to trade with maximum risk - in my case that's 1% per trade.
Harmonic patterns reflect the collective emotions - fear and greed - of traders all over the world analyzing price movements and making their individual decisions for trading. This is what makes the recurring patterns we can see in the charts.
A valid harmonic pattern is one that complies closely with the pattern specifications. Not every M or W shape is a valid pattern. Other criteria I look for in a pattern are:
Number of candles (bars) - The number of bars in the pattern should be 30 or more. The more bars that contribute to a pattern - the better it is.
Pattern Structure -
Most pattern recognition softwares (zup, search-patterns, korharmonics, elementaltrader etc) produce a lot of W and M shapes. Many of which are not real patterns and should not be traded as they don't represent a good high probability trade.
Software just provides a starting point - and it's very important to validate each "pattern" the software identifies, before you jump in to trade it.
Even better, learn to identify the patterns yourself - without the aid of software. You'll find you'll soon be able to sort out the good from the bad real quick. It just takes practice to do that.
The pattern should start with a good "emotional drive" X point. If there isn't s good X then look for another trade.
The Fibonacci ratios of a pattern need to comply with the pattern specification. (see Harmonic patterns "cheat-sheet" specifications ). Nature isn't perfect, so I use a "close enough" rule. As long as price is within say 5-10 pips of the Fibonacci level, that's close enough for me.
For example - according to the Gartley pattern specification, the B should have reached the Fib 0.618 on XA leg and D should then be at 0.786 of the XA leg. I am ok for the B to be "close enough" - not more than about 10 pips from the 0.618. But if the B went to 0.786 of the XA leg - it can no longer be a Gartley - more likely it would be a Butterfly pattern forming. If the B only went as far as the 0.382 or 0.50 on the XA leg, then it also can't be a Gartley - it could only make a Bat or Crab pattern.
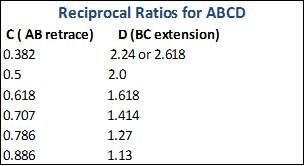
A perfect ABCD is where C is at 0.618 of the AB leg and the D is at 1.618 of the BC leg.
Scott Carney describes the AB=CD pattern in detail, in his book "Harmonic Trading of the Financial Markets: Volume One", available from HarmonicTrader.com
Multiple patterns converging to D
Having multiple harmonic patterns completing in the same PRZ is always a good sign of a high-probability trade. Quite often on a Gartley pattern you will see a smaller Butterfly pattern (with a different X) converging on the same PRZ.
Also, you can often find a small ab=cd pattern within the CD leg of a larger pattern.
If there are no multiple patterns converging on the same PRZ of the main pattern I am trading - then I prefer to trade it lighter (not max risk anyway).
Strong Supply & Demand
The emphasis for this criteria is on the word "strong". We can decide to trade at any supply/demand zone - but the strong ones are more reliable. If the supply/demand zone is not strong - then I may still trade it - but I would trade it lighter with maybe 0.5% risk instead of the 1% that I use if all the criteria above are satisfied.
Criteria for a strong supply/demand area will include:-
- Short time at the supply/demand level: Number of candles/bars at the supply/demand level should be few - say around 5 or 6 ideally
- Rapid move away from the level: - a rapid move away indicating a strong imbalance in price at the level
- Higher Timeframe alignment: - use supply/demand levels that are at or close to supply/demand levels on a higher timeframe
- First time back: - price returned to the level for the first time after it had moved away a significant distance (usually by 3 times the range of the supply/demand level itself)
- Fast speed of return to the level: - We don't want to see gradual, slow approach - fast arrival usually means fast departure.
The 7 Deadly Sins
I have these written on my Trade Log Planner to remind me of the key times I should stay out of the market. (I need reminding!).
A few pointers on each one...
1. New trade just before news
Especially red-flag news. Its always best to wait to enter a trade till the random fluctuations and turbulence caused by news have died down. I don't trade news, so I won't enter a trade up to 60 mins before key news announcements and leave it for 30 mins afterwards.
2. Influenced by others
If you attend trading chat rooms and a few people get excited by entering a trade - it's sometimes difficult not to get caught up in the excitement too - and before you know it - you're in a trade you didn't plan to be in. See "#6 - Impulsive Trading" below for a remedy to this.
3. Friday Afternoons and Sunday Evenings
Forgive me friends - I'm in the UK, so I mean the last half London session of the week (afternoon GMT) and the first Asia session of the week (Sunday evening GMT).
At these times trading volumes are much lower than at other times during the week. For the probabilities to work, we need volume and liquidity.
So - I don't trade those times.
4. CPI or Interest Rate Announcement in 24 hrs
An impending CPI news or an interest rate announcement by a Central Bank (or the Fed) can effect the behaviour of a currency for days - but certainly for the preceding 24 hours - before the actual announcement.
You never know if the rate hike has already been priced in (so if the rate hike doesn't happen the currency drops) - or if it has not been priced in (so when the rate hike happens the currency spikes up). I don't like to play this game of second-guessing - so I stay out of the effected markets until the news is over.
5. Over-exposed on one currency
Not just on one currency - but also on correlated pairs. Eg Eurusd and UsdChf - no point being in trades on both at the same time.
6. Impulsive Trading
OK - I admit it! I know I am impulsive.
Especially when I am not in the market (flat) and I see a reasonable-looking pattern appear - I feel a strong urge to enter that trade, right away. This is something I really have to work hard at to control.
The way I avoid impulsive trading is by spending a few minutes completing my Trade Log Planner before I take a trade.
Those few minutes entering details into my Trade Log Planner have the big benefit of slowing me down in my decision-making - and getting me into an objective frame of mind.
The result is I filter out more not-so-good trades. And I also consider the trade risk profile more carefully - I want to avoid putting on too many lots when I should have entered the trade lightly - or, alternatively, trading too lightly when I should have traded more lots to accelerate profits.
7. Entering a trade too early
I have found from experience that it is best not be too hasty to enter a trade. Many times price will reverse from a supply/demand zone and/or a pattern PRZ reversal zone, only to come back a few bars later for a retest of that same area (I am sure you've seen double-tops or double-bottoms in the charts). Failed impulse waves are where price returns to retest the reversal zone and actually exceeds the previous high (or low) to make a second spike - before eventually reversing. Its easy to get stopped out in these cases.
So that I don't get into trades too early, I wait until i see a Reversal or Divergence RSI signal. Then and only then will I enter the trade.
In summary
I use the above harmonic trading entry criteria as a set of objective rules to improve my trading. It works for me - maybe there's something in here that will work for you too.
Good Trading!


Trading Resources
Money Management
Learn how Adaptive Position Sizing can grow your account balance - exponentially.
Cash rebates on your trades.

Real-time harmonic alerts to pc and email. Free harmonics education videos and harmonic software. Harmonic traders chat room.

Certified Harmonic Training Webinar Series
Certified Harmonic Trading Educational Webinar Series
Over 15 hours of educational lessons narrated and presented by the originator of Harmonic Trading, Scott Carney.
Money Management
I use ForexSmartTools to run my forex trading business. Watch the video - see how they work

Further Reading
 Good Books for Harmonic Traders
![]()
Copyright © 2009-2010 Trade-Forex-Harmonic-Patterns.com. All rights reserved.