|
|
MY MASTER THESIS
The Integration of Noise Simulation, Visualization and 3D GIS for Rosensteinviertel in Stuttgart
[ March 2006 / Stuttgart, Germany ]
Supervisors: Professor Dr. Volker Coors
Report Cover downlaod
Report download
Presentation download
Poster download
- Abstract:-
Sound can be generated by many different sources and can be perceived as noise by humans in many different conditions. Nowadays noise consider as a pollution issue affect on our environment like air and water pollution, however, Environmental noise, as defined, is the sound generated by human activity (road traffic, railways, air trans-port, industry, recreation and construction), this why most of countries start creating noise maps to control the noise within a certain standards.
Noise mapping is not a new activity. Noise maps have been produced in many coun-tries in European community since the 1970-ies. For the purpose of the present State of the Art, report it is intended to give an overview of noise simulation to produce noise maps, what were they used for, how were they produced, what methods and indicators have been used, what difficulties were encountered and how were these solved?
Noise should be stored and manipulated by means of existing GIS technology, which offers very good tools for noise management. Using GIS not only simplified the noise mapping but also give a wide range of production, tables or maps, it is used for inven-tory surveys, impact analyses, and planning projects. There are several software pack-ages available in the market for noise mapping, which cover noise mapping in wide range, even though, the aim of this research is to use the available GIS tools (ArcGIS) to prepare a noise map for ROSENSTEINVIERTEL new development area in
STUTTGART/GERMANY, by preparing a simple tools (Microsoft Excel) work together with GIS tools and support it to prepare the noise maps by defining a simple methodol-ogy according to existing standards define the methods of calculating noise and noise attenuations.
- Keywords: -
Sound, Noise, Acoustics, Simulation, Mapping, Modeling, 3D Visualization, GIS, MS Excel and ArcGIS.
- Introduction:-
Within the last few years, especially with increasing the numbers of countries enter the European Union; environmental pollution is a widely used term which defined as a re-lease of harmful environmental contaminants. Generally, traditional forms of pollution include air pollution and water pollution while a broader interpretation of the word has led to the ideas of light and noise pollution.
Sound can be generated by many different sources and can be apparent as noise by humans in many different conditions. In general the noise studying divided into two parts, Indoor and Outdoor, the indoors concentrated on noise behavior, characteristic and measurements inside the building while the outdoor is interested with noise due to the wide range source in open area like traffic and industrial sources, the outdoor noise can be represented as a map shows the noise values in large area.
Noise mapping is not new, especially in European countries since they are interested in noise calculation and maps presenting from 1970-ies. Preparing noise maps depend on the purpose of map used, in addition to this the result of noise depend on the noise indicator that different from country to another, and from standard to another standard, so it depend on the indicator and method of calculations or measurements. Noise maps are produced for different purposes, the most common one is the identification of hot spots or critical areas. A second important purpose of noise maps is to help monitor a certain development in time, and to compare this development with a desired goal. The aim of noise mapping is to provide objective physical value of noise which can be com-pared with standard value in order to judge its acceptability.
Generally, there are many scenarios to produce the Noise maps, which mainly depend on the noise source; this work concentrate on traffic noise. using both ArcGIS and Ex-cel programs and show simple way to produce the noise maps, since ArcGIS and the same MS Excel are widely used, and provide a method of work that use the functional-ity available in ArcGIS beside the powerful functionality from Excel to produce the noise maps, using Excel shows the simplicity of creating tools have the ability to calculate the noise level, this open the door to future work to create plug-in working under ArcGIS environment, may this tools have more functionality to prepare the data and showing the output maps with proper way.
The following is a description of the contents for the several chapters included in this thesis:
Chapter one till Chapter three are introduction, objectives and state of technology.
Chapter four briefly describes the physical properties of noise and the noise propaga-tion in air.
Chapter five deals with international standards and European directives
Chapter six covers the technical noise analysis including the types of noise calcula-tions, types of receivers and the road and railway noise.
Chapter seven and eight describe the noise modeling, visualization and noise map-ping (types, scales, indicators, and so on).
Chapter nine shows the methodology used in this work to create a 3D noise map for Rosensteinviertel area.
The final part is Chapter 10, which summarizes the work done and some recommen-dation beside the possibility of future modification.
It is hoped that this thesis will assist the newcomer GIS people to do more powerful tools create noise maps using ArcGIS or any other software.
- Objectives: -
This work aims to prepare noise maps using ArcGIS tools for ROSENSTEINVIERTEL new development area in STUTTGART/GERMANY, and present a simple methodology using available in hands GIS tools to do noise simulation, to fulfill the main goal of the thesis and to find the simple way to produce the noise map, this research seeks to ac-complish the following objectives:
Present a simple methodology of work that is able to simplify the noise calculation and produced the noise maps to give the citizens a rough idea of the impact of changes/planning scenarios, this methodology focus more on simplicity and feed back time instead of accurate results.
- Summarize the main German standard related to Noise calculation including the calculation of main sources and the attenuation affect on noise level at any point.
- Proof the ability of using simple way to calculate the noise and using available in hands GIS tools to do noise simulation.
- Preparing noise map for ROSENSTEINVIERTEL area.
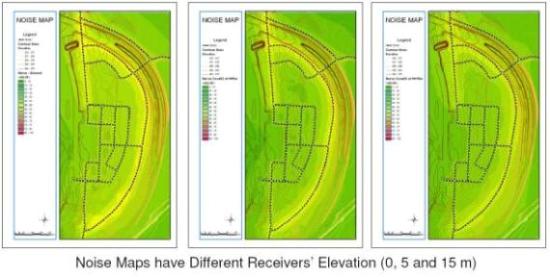
- Representations of the noise level in complex terrain where Z-value affects on noise level.
- Showing the noise maps result before and during the development of the test area (Rosensteinviertel/Stuttgart).
This work lead to a future work to create a plug-in tools work under ArcGIS environ-ment, this tools can be manage all working process and have all the functionality needed to prepare noise maps. In addition, this opens the mind to present the work under web pages not only in 2D maps but also in 3D scene using VRML extensions.
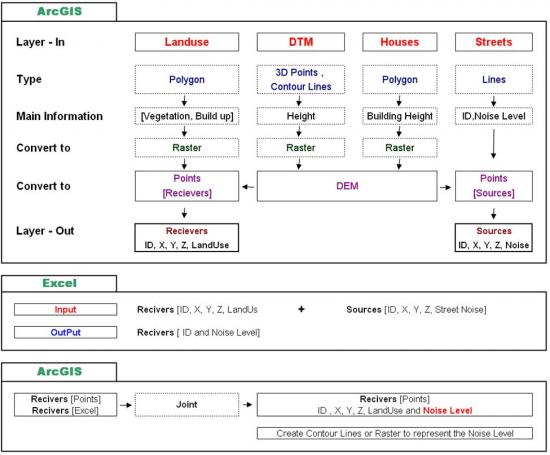
- Methodology: -
This chapter shows the main idea and the steps of doing a simple noise mapping using ArcGIS in cooperation with MS Excel, and represent in the noise as contour lines or grid maps. This work covers some parts of noise mapping especially for attenuation calculation. The items reflection and horizontal screening are not covered here.
The work steps followed the German specification. This does not mean that this is only related to this specification, it can be easily modified to cover any other specifications.
To simplify the concept of work, The Figure below shows the main work steps using both ArcGIS and Excel to produce noise map.
- Summary: -
The main objectives of this thesis were to show a simple method of creating a noise map using an available GIS simple functionality by using built in house simple vba code work under Excel environment.
The subject of this thesis was decided after introducing the New Regulation for Euro-pean Noise Directive, this topic goes up in the development countries since noise is considered one source of environment pollution, this will encourage developing coun-tries to take part and start creating noise maps for their cities. For simple project, this work cover all requirements to create this type of maps, on the other hand it has a flexible idea that can easily change the equation to follow the standards used in that country. Noise mapping is a well-established practice in many European countries. It is an integral part of the process of developing an ambient noise strategy, no organization or person is specifically engaged in the subject of noise mapping in developing coun-tries, at least not deliberately.
The cost of existing software some times affect of the decision of working in small pro-jects, simple tools always look like encourage tools to work within certain accuracy, while the price of special noise software not affect of large project, the good advantage of working with like this tools give the user (or the user must have) a very good back ground on noise and its behavior, the large software have which called THE END USER, just import the data with some modified tools and having the results output, actually the people who can not analysis there results have problems with their pro-jects.
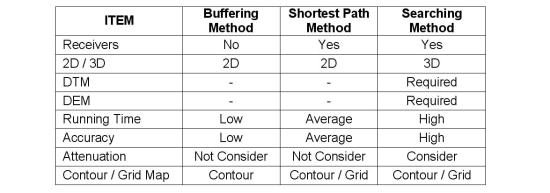
The noise map creating methods divide regarding to this work into three types: Buffering method create a zone around the source lines having a uniform noise level of noise. This method neglects the effect of other sources, so the noise lines take the shape of sources. The second method creates regular points covering the test area. Each point is called receiver, the noise level at each receiver is the combination of noise of all sources using the shortest path between the receiver and the source. This method is more accurate than the buffering method in 2D. In case of using this method in 3D the attenuation affect is limited only with shortest path. To solve this problem the source line was divided into points and then the noise at each receiver calculated from each point. Accuracy of the results of this method depends on the distance between points (both receivers and sources). The run time is also depended on that point. The table below summarizes the main difference between each method.
Furthermore, for a proper understanding of noise maps it is important to understand the behavior of noise and the standards method of calculation. In addition, not to focus on GIS tools but rather on how GIS can contribute to make the organization function
better. ArcGIS should not be seen as just a program with which one can make nice maps and use limit functionality, but should be an integral part of the whole information system.
This study produced some general outcomes that are of direct relevance to Rosen-steinviertel developing area / Stuttgart. The maps produced using the developed tools, and their accuracy depends on many factors: Of course the input data accuracy is very important to have acceptable results.
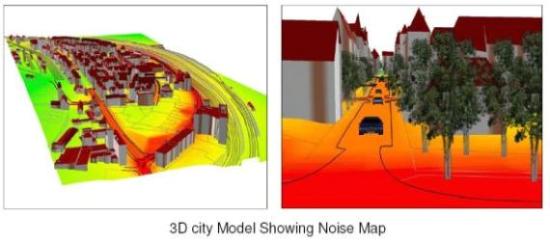
The last recommendation from this work experience is that there is a way somehow to solve any problem using the available tools at hand. This work proves one example of creating noise maps not only in 2D but also in 3D by simple programming code under Excel environment, beside that integration of different programs sometimes simplified the work and give good results.
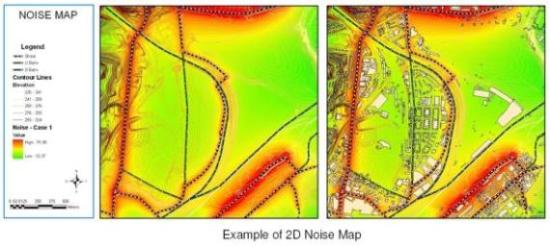
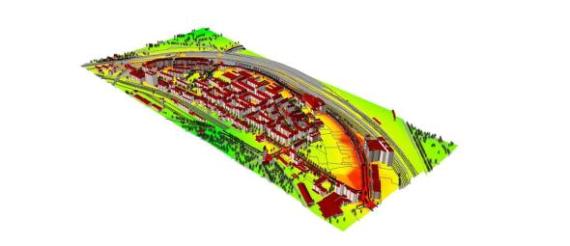
- Results: -
- 3D Visualization: -
TOP
|