Microsoft Excel Line Graph of A Stock
Finished Line Graph Example
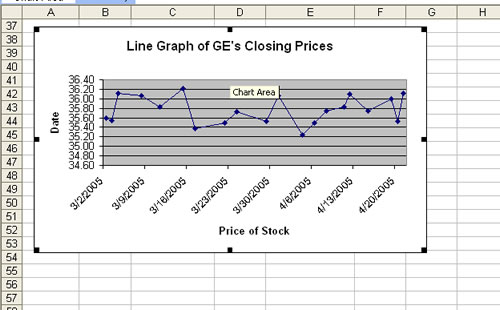
Learn How to Make this Line Graph Example
- Click the Chart Button on the toolbar across the top of the screen. If you do not see the button on the toolbar, go to
Insert, and then scroll down to chart.
- The Chart Wizard bar will appear, select Chart Type: Line.
- Click on the appropriate chart that you want to use.
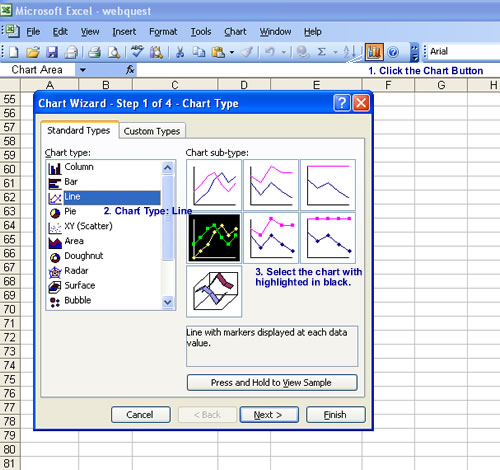
- Click Next.
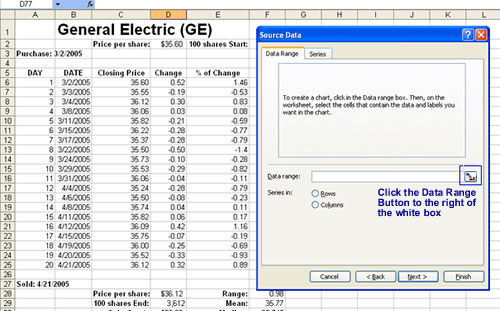
- Click the Data Range Button to the right of the white box.
- Highlight the Data Range in the appropriate columns. The X-axis should be the date of the stock check, while the
y-axis is the prices of the stock on the days you checked your stock.
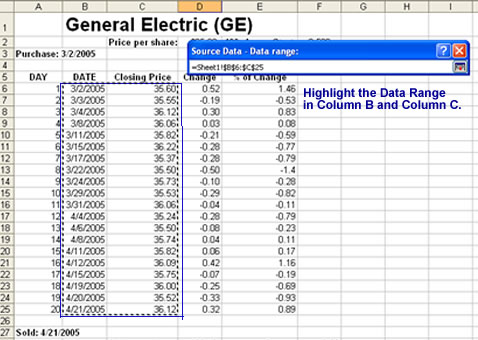
- Click the Data Range Button, and you will return to the chart wizard.
- Click Next.
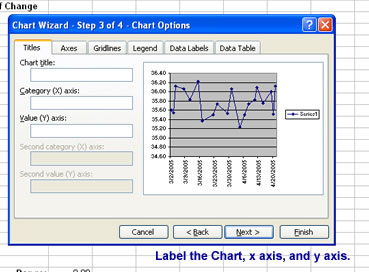
- Label the x-axis and y-axis. Also, give the Line Graph a title.
- Click Next.
- Then click Finished, and you have created a Line Graph of your closing prices.

Created By: Victoria Rowekamp
Last updated: April 22, 2005

