


 R. Manasseh Papers
 R. Manasseh Home
As an illustration of some properties of gust distributions, a single day,
13 April 1994, will be used. True-direction gusts will be used. On this day
Sydney suffered exceptionally strong, gusty southerly winds throughout most of
the 24 hour period under consideration, from 1200 on 13 April to 1200 on
14 April, caused essentially by synoptic conditions. Average wind speeds
were 10-15  (20-30 knots) and the peak two-second gust was
32 (64 knots). According to controllers the weather caused a
significant backlog of flights at Sydney Airport. Blackouts occurred in the
metropolitan area owing to power line failures.
(20-30 knots) and the peak two-second gust was
32 (64 knots). According to controllers the weather caused a
significant backlog of flights at Sydney Airport. Blackouts occurred in the
metropolitan area owing to power line failures.
Table 1 shows the distributions of
gusts for this day. The gust `bins' are defined in increments of 0.5
or approximately 1 knot. For example the bin labelled `+10' contains all
positive gusts greater than or equal to 5 ( knots) and less
than
knots) and less
than  (
( knots); similarly the bin labelled `
 10'
contains all negative gusts from
10'
contains all negative gusts from  to and equal to
 (-10 to -9 knots). The
  bin contains any negative gusts
with magnitudes greater than or equal to
bin contains any negative gusts
with magnitudes greater than or equal to  and the
  bin
contains any positive gusts with magnitudes greater than or equal to
bin
contains any positive gusts with magnitudes greater than or equal to
 . In table 1, the
columns of figures themselves form a kind of crude histogram, which has the
advantage of being effectively on a logarithmic scale. Sorting the gusts into
bins in increments smaller than 0.5 (about 1 knot) would make little
sense since the resolution of the original data was 1 knot.
. In table 1, the
columns of figures themselves form a kind of crude histogram, which has the
advantage of being effectively on a logarithmic scale. Sorting the gusts into
bins in increments smaller than 0.5 (about 1 knot) would make little
sense since the resolution of the original data was 1 knot.
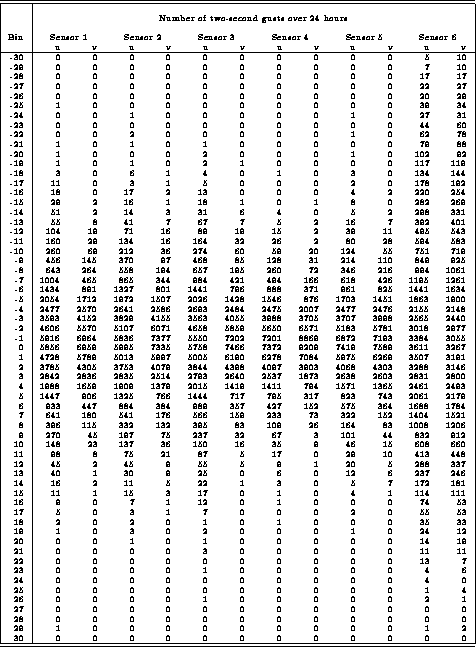
Table 1: True-direction gusts at Sydney Airport and Kurnell on 13 April 1994.
Bin increment is 0.5 , so the `bin number' is approximately the level
of the gust in knots. To view this table as a histogram, note that the true
zero on the `bin-number-axis' is halfway between 0 and  .
.
When gusts of all magnitudes are considered, the results (from 13 April 1994)
show mean gust speeds are effectively zero at all sensors in both the  and
and
 components, so there was no preference on average for gusts with or against
the local mean wind. The gust variance at sensors 1-5 is between about 2 and
4 but is about 10 at sensor 6, probably because of that
sensor's poor placement behind a sand dune. For the component, skewnesses
are generally
components, so there was no preference on average for gusts with or against
the local mean wind. The gust variance at sensors 1-5 is between about 2 and
4 but is about 10 at sensor 6, probably because of that
sensor's poor placement behind a sand dune. For the component, skewnesses
are generally  and negative for sensors 1-4 and
  and
negative for sensors 5 and 6. For the component, skewnesses are
and negative with the exception of sensor 2, whose data has a positive skewness
of 0.04. Negative skewnesses indicate a preference for higher gusts with a
northerly component; the southerly wind tended to occasionally drop well below
its mean while frequently increasing a little above it. Kurtoses are negative
(platykurtic) and
and
negative for sensors 5 and 6. For the component, skewnesses are
and negative with the exception of sensor 2, whose data has a positive skewness
of 0.04. Negative skewnesses indicate a preference for higher gusts with a
northerly component; the southerly wind tended to occasionally drop well below
its mean while frequently increasing a little above it. Kurtoses are negative
(platykurtic) and  , with the exception of sensor 4, whose data have a
positive kurtosis of 0.13. The mainly platykurtic nature of the distributions
indicates that the gust distributions are broader than a normal distribution.
There are over 46000 samples per sensor used in these overall results.
, with the exception of sensor 4, whose data have a
positive kurtosis of 0.13. The mainly platykurtic nature of the distributions
indicates that the gust distributions are broader than a normal distribution.
There are over 46000 samples per sensor used in these overall results.
It is clear that statistics based on the distributions of gusts of all
magnitudes will be controlled by the preponderance of gusts of trivial
magnitude. For example, during a single day there may be thousands of `gusts'
where the two-second speed exceeds the local mean by only 1 , but
only a few gusts of magnitude 10 or greater. It is the stronger
gusts that are of relevance to aviation safety. For this reason the gust
statistics are re-calculated for gusts with magnitudes greater than or equal to
5.0 . For brevity these thresholded gusts will be called GE5 gusts; gusts of all magnitudes are GE0 gusts.
When only GE5 gusts are considered, the day's sample sizes drop from thousands
to hundreds in the -direction, and to some tens in the -direction. Thus,
considering GE5 gusts over a much shorter period such as one hour would greatly
reduce confidence in the statistical parameters.
Statistics are computed using `relative' GE5 gusts, where
5.0 has been subtracted from the positive GE5 gusts or added to the
negative ones. Mean gust speeds are no longer zero but are still not very
significant, the means with largest magnitudes being -0.8 at sensor
6 for the direction and -0.8 at sensor 6 for the direction.
Means are  or smaller at other sensors, which is less than the
0.5 resolution of the instruments.
or smaller at other sensors, which is less than the
0.5 resolution of the instruments.
Variances for the component are now between 1.5 and 2.0 at
sensors 1-5 and 6.0 at sensor 5; variances for the component are
between 0.6 and 1.5 at all sensors. Thus the use of the relative GE5
gusts has resulted in a more uniform set of variances. Unlike GE0 skewnesses,
GE5 skewnesses are of variable sign and in both directions. Thus the
distributions of GE5 gusts are certainly skewed but not systematically.
However, the smaller sample sizes, particularly of gusts in the -direction,
imply that the higher moments are less reliable. Kurtoses are also of variable
sign and in both directions.
R. Manasseh Papers
R. Manasseh Home