Discussion
Habitat and Fruit Resources
It was evident that at some lodges there was significant variation between T and C in terms of the abundance of the five most common fruiting tree genera (Iriartea, Scheelea, Astrocaryum, Pseudolmedia and Ficus), however there was no evidence to suggest that tourists or the presence of trails was a factor in this and is likely a consequence of natural variation. Significant differences in the abundance of fruit tree genera and other genera between lodges as a whole was most apparent with Iriartea, a likely consequence of past utilisation of this palm by people, and Guadua, which was completely absent from the two lodges along the Madre de Dios river, perhaps due to a lack of source propagules for the northern bank of the river. Guadua was relatively common however along the length of the Tambopata river.
There was no evidence to suggest that the total abundance of fruiting trees (11 genera) at a lodge had any effect on the abundance of individual mammal species, although the underlying greater availability of fruit at the TRC may help to explain the greater mammal diversity and the abundance of certain communities such as primates and ungulates.
Mammal Species with Insufficient Data
13 species were encountered too infrequently or only at one lodge for it to be possible to determine with any degree of confidence which variable (habitat, hunting, or traffic) may be responsible for the variation in their abundance. These included: M. tridactyla, B. variegata, Dasypus sp., Aotus sp., C. albifrons, A. paniscus*, A. microtis, G. vitata, L. longicauda, L. pardalis, T. terrestris*, T. pecari*, and M. pratti. However, some of these species (*) show some affinity to having been impacted by historical hunting levels at those lodges situated close to settlements.
Species Affected by Hunting
It is a known fact that local inhabitants in Amazonia frequently hunt wild animals for subsistence purposes and for the bush-meat trade, and studies have shown that this can seriously deplete local population abundance of certain species (Ayres et al. 1991, Bodmer et al. 1994, 1997, Fragoso 1991, Hill et al. 1997, Maglianesi 1998, Mittermeier 1993, Noss 1998, Peres 1990, 1996, 1999). Hunting where present has to be regarded as a stronger impact variable than tourism because it actively extracts individuals from the population. Tourism disturbance in Tambopata doesn’t actively or knowingly kill mammals on a regular basis. As it is evident that hunting is very prevalent near two of the lodges studied (SACHA and CAPH) and historically present around two others (ECO and EI) it is necessary therefore to determine which species are being impacted primarily by hunting above and beyond the effects of tourism.
In this part of Amazonia nine of the species encountered in this study are commonly sought by hunters. These include black spider monkey, white-fronted capuchin monkey, red howler monkey, brown capuchin monkey, south american coati, brazilian tapir, white-lipped peccary, collared peccary, red brocket deer, brown agouti (Freese et al. 1982, Ascorra 1997). Furthermore, cats such as the jaguar and ocelot are also killed if they are encountered as they are considered a menace to livestock and there is still a local market for their skins (though small). On simple visual inspection of the abundance profiles of these species it was evident that the abundance of the red howler and brown capuchin monkeys were strongly influenced by the hunting pressure index at a lodge. Insufficient data was available to test the black spider monkey, white-fronted capuchin monkey, brazilian tapir, and white-lipped peccary. The collared peccary, red brocket deer, brown agouti and south american coati appear unaffected by current hunting pressure. These species are discussed in more detail below. The track abundance patterns for the cats indicate that the jaguar and the ocelot are affected by current hunting pressure, although the ocelot appears to be more resistant.
Black Spider Monkey (Ateles paniscus)
The black spider monkey is evidently locally extinct around the four lodges closest to civilisation, a likely result of historical hunting pressures before the onset of tourism development in the area (Figure 3.25). Some good news is that there were three unconfirmed reports during 1997-98 of sightings at EI, SACHA and even within the native community of Infierno. So it is possible that this species could recolonise certain locations if hunting is controlled. At the TRC, this species still survives in relative abundance, however the results hint at a possible negative impact of traffic, although further investigation would be required to test this. In Manu where the species is also common, Yoon (1997) found that this species was not affected by tourist traffic, however traffic levels along the tourist trails that he studied were on the whole lower than those at the TRC.
Figure 3.25. Relative abundance of the black spider monkey (Ateles paniscus).
Brazilian Tapir (Tapirus terrestris)
In the case of the brazilian tapir insufficient visual encounter data was available to undertake any meaningful analysis. However, track data revealed that although the species was present at all the lodges it was most abundant at the TRC and EI (Figure 3.21), the two lodges where hunting pressure was found to be lowest. A Pearson correlation coefficient revealed that track abundance was negatively correlated with hunting pressure (Pearson = -0.75), although it was not significant. There was no evidence from the track survey to suggest that this species is affected in any way by tourist traffic.
White-lipped peccary (Tayassu pecari)
The white-lipped peccary was also observed too infrequently to assess the significance of any impact variable directly, however our data mirror the opinion of local people who suggest that this species is generally rarer around permanent settlements where hunting pressures are highest and more abundant in isolated areas such as the TRC, an opinion also backed up by other studies of this species (Fragoso 1991, Kirkby et al. 1998, Kirkby 1999).
No evidence was found to suggest that tourism affects this species. The fact that the home range of this species is one of the largest for any Neotropical mammal makes it very unlikely that a group of white-lipped peccaries would be able to adequately perceive areas of high tourist traffic and actively avoid them, as their visits to the trail systems of lodges tend to be extremely infrequent and usually last no longer than a few hours. Never-the-less, the experience of one of the authors (CK) with this species suggest that the groups encountered at the TRC were unusually shy and tended to flee a lot earlier and for greater distances than in areas of Madre de Dios where the presence of humans is negligible. This may be due to underlying human odours in the forest around the TRC which may make the species more wary and prone to fleeing.
It is known that this species is susceptible to disease and it is believed the regional abundance of this species may fluctuate wildly over a period of decades. Introduced diseases carried by domestic animals have also been implicated in this phenomenon and may also help to explain the absence of this species from most of the lodges which are situated near human settlements. Once eliminated from an area by hunting or disease it may take many years for them to naturally recolonise.
It is the opinion of the authors that as a tourism resource this species has a lot to offer, due to its tendency to create large noisy groups, and efforts should be made to protect it from over-hunting near tourist lodges.
Other species: Testing for the effects of traffic
For 13 species paired t-tests (1-tail) were used to investigate whether there was any consistent difference in abundance between T and C transects (Table 3.19). This revealed that two species (brown capuchin monkey and red brocket deer) are consistently more abundant along C and two others (southern tamandua and bolivian squirrel) are consistently more abundant along T. These species are discussed in more detail below.
Table 3.19. Results of paired t-tests (1-tailed) comparing the abundance of each of 13 species between tourist and control transects at 5 lodges (h = species shown to be primarily affected by hunting), * p < 0.05, ** p < 0.01, + almost significant (p < 0.07).
| Species | Ave. T |
Ave. C |
p |
. |
| Southern Tamandua | 0.016 |
0.006 |
0.03 |
*T |
| Saddleback Tamarin | 0.787 |
0.580 |
0.41 |
. |
| Squirrel Monkey | 1.399 |
1.053 |
0.30 |
. |
| Dusky titi Monkey | 0.046 |
0.071 |
0.23 |
. |
| Red Howler Monkey (h) | 0.163 |
0.073 |
0.06 |
+T |
| Brown capuchin Monkey (h) | 0.329 |
0.465 |
0.05 |
*C |
| South American Coati | 0.047 |
0.074 |
0.47 |
. |
| Tayra | 0.031 |
0.035 |
0.43 |
. |
| Collared Peccary | 0.066 |
0.092 |
0.20 |
. |
| Red Brocket Deer | 0.005 |
0.026 |
0.01 |
*C |
| Bolivian Squirrel | 0.096 |
0.069 |
0.03 |
*T |
| S. Amazon Red Squirrel | 0.493 |
0.430 |
0.38 |
. |
| Brown Agouti | 0.138 |
0.134 |
0.36 |
. |
Southern Tamandua (Tamandua tetradactyla)
The above analysis indicates that the species is positively affected by traffic, even though the overall number of encounters is insufficient to have any real confidence in this result. Interestingly, it was not observed at the CAPH (Figure 3.26), although other members of the research team encountered it on a couple of occasions so it can’t be considered as locally extinct at this lodge. At all other lodges abundance was restricted mainly to the tourist transects. A Pearson correlation analysis between traffic and abundance along T did not reveal any underlying trend. In truth there were insufficient encounters with this species at most lodges to be very confident that this species is affected unequivocally by traffic and we suggest that further study is undertaken.
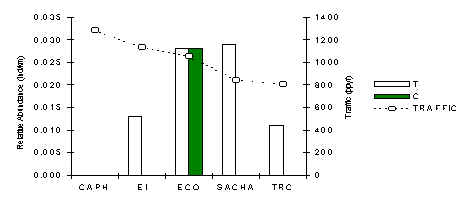
Figure 3.26. Relative abundance of the southern tamandua.
Brown Capuchin (Cebus apella)
The pattern of abundance of this medium sized primate (member of the insectivore-frugivore guild) at CAPH and SACHA is consistent with the claim that the species is negatively affected by hunting (Figure 3.27). However, there was also a relatively consistent trend of higher abundance along C transects (Table 3.19), more especially at the four lodges located near permanent settlements where hunting is currently or has historically been prevalent. So, although primarily affected by hunting, there are significant signs that the species is also being susceptible to the presence of tourists within their habitat.
This difference between T and C could very well be the result of an innate fear of people, particularly amongst those local populations near settlements which could have developed this fear after occasional contact with hunters. Indeed it is possible to speculate that this species is unable to tell the difference between tourists and hunters. A Pearson correlation analysis between traffic and abundance along T transects at the 3 lodges unaffected by hunting revealed a strong negative correlation, although it was not significant (Pearson = -0.95, p < 0.10).
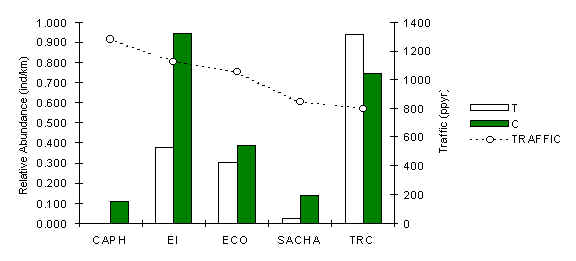
Figure 3.27. Relative abundance of the brown capuchin monkey.
Red Howler Monkey (Alouatta seniculus)
The pattern of abundance of this large folivorous/frugivorous primate clearly demonstrates that the species is strongly and negatively influenced by hunting pressure (Figure 3.28). Interestingly however, it was consistently more abundant along T transects, particularly at EI and TRC, indicating that the species is likely affected in a positive fashion by the presence of tourists, even if under the pressure of hunting. A Pearson correlation analysis revealed that there was no evidence to suggest that the species is affected in any way by the magnitude of traffic. We can only speculate at this stage with regards to the underlying reasons behind this pattern. It could be a reduction in predation pressure near the trails, although there is little data on the abundance of large eagles such as the Harpy Eagle (Hapia harpyja) to test this, and/or a reduction in inter-specific competition. It is also plausible to conclude that the species may have attained a degree of habituation to tourists, which would make these otherwise secretive species less likely to flee from the areas close to the tourist trails and could even have contributed to an improved detection profile for the observers, although no evidence in terms of average straight-line detection distance was apparent.
Figure 3.28. Relative abundance of the red howler monkey (Alouatta seniculus).
Red Brocket Deer (Mazama americana)
The analyses revealed that this species is the most consistently and most strongly influenced by traffic. At all lodges the abundance along control transects was greater than along tourist transects (Figure 3.29), although the strength of the relationship was less evident at the TRC. A Pearson correlation between traffic and T abundance revealed a strong negative correlation (Pearson = –0.88, p < 0.05). The overall pattern, using pooled data per lodge, is consistent with a claim that the species is negatively affected at a very localised level by tourists. That is to say they appear to be scared away from areas close to the tourist trails, although it appears that these displaced animals can survive greater densities in the control areas, particularly around the lodges near permanent human settlements where there is evidence to suggest that cats such as the Jaguar, which are potential predators of this species (Terborgh & Emmons unpubl.) are much less common.
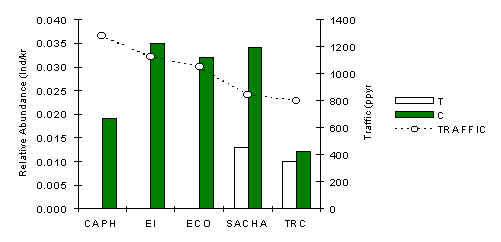
Figure 3.29. Relative abundance of the red brocket deer.
Bolivian Squirrel (Sciurus ignitus)
At four lodges the abundance of this species along T was greater than along C (Figure 3.30), which implies that the species is likely positively affected by the presence of tourists. It appears that the species is sensitive to very small levels of tourist traffic, even below that of the TRC. However, a Pearson correlation analysis between traffic and abundance along T transects revealed that it is not sensitive to the different traffic intensities we tested. The variability in abundance along T was found to be greater than along C (SD; T = 0.06, C = 0.04) indicating that abundance is more stable away from tourist trails.
At ECO the species was evidently uncommon, likely the result of some unknown habitat or predation variable, although it could also be loosely coupled to the abundance of its principal competitor, i.e. the Southern Amazon Red squirrel, which is significantly larger and more aggressive and was observed chasing the bolivian squirrel on numerous occasions. However, no significant correlation was evident between these two species.
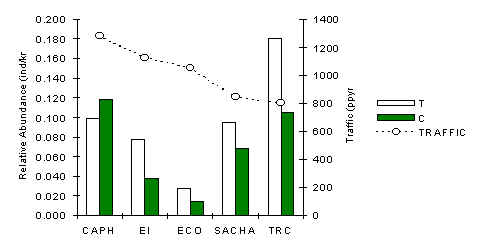
Figure 3.30. Relative abundance of the bolivian squirrel.
Species Sensitive to Traffic Intensity
Pearson correlation analyses between T abundance and traffic, on the same 13 species described in Table 3.19), revealed 3 significant results (Table 3.20). Two species were significantly positively correlated (saddleback tamarin and southern amazon red squirrel) and one was negatively correlated (red brocket deer - a species which was also singled out in the above paired t-tests). The difference in the standard deviation values between T and C for these three species was also large, and in the case of the tamarin and the red squirrel, abundance along C was more stable than along T, as might be expected if traffic were playing a significant role in affecting these species.
Table 3.20. Pearson correlation, T abundance vs. traffic, and the % difference between T and C in terms of standard deviation (SD) from the mean. * p < 0.05, (T) = SD of T > SD of C.
| Species | Pearson | . | %Difference SD (T vs. C) |
| Southern Tamandua | - 0.539 | . | . |
| Saddleback Tamarin | + 0.916 | * | 272 % (T) |
| Squirrel Monkey | - 0.854 | * | 251 % (T) |
| Dusky titi Monkey | + 0.384 | . | . |
| Red Howler Monkey (h) | - 0.226 | . | . |
| Brown capuchin Monkey (h) | - 0.532 | . | . |
| South American Coati | - 0.477 | . | . |
| Tayra | - 0.460 | . | . |
| Collared Peccary | - 0.044 | . | . |
| Red Brocket Deer | - 0.883 | * | . |
| Bolivian Squirrel | - 0.498 | . | . |
| S. Amazon Red Squirrel | + 0.946 | * | 167% (T) |
| Brown Agouti | + 0.517 | . | 191% (T) |
Saddleback Tamarin (Saguinus fuscicollis)
The pattern of abundance of this tamarin [a small primate and member of the frugivore/insectivore guild] is very similar to that observed for the southern amazon red squirrel, a mammal of similar size (Figure 3.31). A correlation analysis between traffic and abundance along T transects revealed a positive and above all a significant relationship (Table 3.20). The same analysis along C transects also revealed a positive relationship, although it was not significant. The abundance pattern and these results suggest that once the effects of traffic begin to be felt they appear to reach into the forest beyond the immediate vicinity of the tourist trails. The variability in abundance along T was also found to be greater than along C (SD; T = 0.66, C = 0.24), which adds further fuel to this argument.
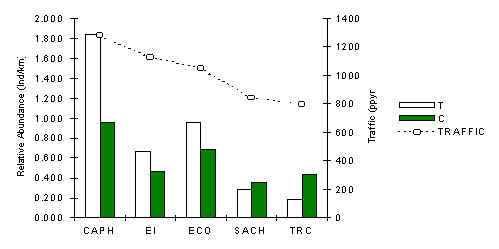
Figure 3.31. Relative abundance of the saddleback tamarin.
Southern Amazon Red Squirrel (Sciurus spadiceus)
The abundance pattern of this species (Figure 3.33) as indicated is remarkably similar to that of the saddleback tamarin (above). A Pearson correlation coefficient was calculated between traffic and T abundance which revealed a significant positive relationship (table 3.20). This indicates that the species is sensitive to the magnitude of traffic. Furthermore, the variability in abundance along T (SD = 0.25) was found to be greater than along C (SD = 0.15), which leads us to reach similar conclusions regarding the positive impact of traffic on this species.
Although the abundance of this species and that of the saddleback tamarin were found to be extremely similar (Regression, Z = 66.517, p = 0.000), there was no evidence from behavioural data of extensive inter-specific associations between these species in the field, although on a few occasions they were observed foraging near one-another although not more so than would be predicted by chance. There is very little if any dietary overlap between these two species, although we provide some evidence to suggest that they are more abundant in forests where underlying fruit tree density is low. It is also plausible to speculate that these species are being affected by a common set of predators, for instance hawks, falcons, ocelots, which would be consistent with their size, foraging habits and preference for foraging in the lower canopy, although insufficient data on these predators was available to test this hypothesis.
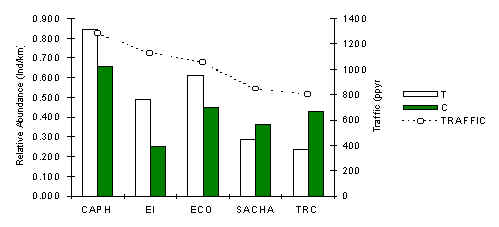
Figure 3.33. Relative abundance of the south american red squirrel.
Squirrel Monkey (Saimiri boliviensis)
The abundance pattern of this small primate (Figure 3.32) shows a considerable amount of variability between T and C from lodge to lodge. Overall the variability in T was found to be greater than along C (SD; T = 1.46, C = 0.58). A Pearson correlation analysis between traffic and T abundance revealed a significant negative relationship (Table 3.20), indicating that an association may exist and that the magnitude of trail-use intensity may be affecting abundance. The large home range size of this species may also have affected the results. A large home range makes it more difficult to identify a difference between T and C, if it exists, because the average separation distance between these two types of sample area are on the whole well within the distance that typical groups of this species may cover in a season. This means that the resident group(s) at the lodges may be forced, through ecological necessity to traverse and use areas near T and C in their search for food, shelter and for moving across their home range.
After combining the abundance data for T and C a Pearson correlation analysis with traffic revealed an even more significant negative correlation than before (Pearson = -0.87, p < 0.05). However, there is exists a stronger correlation between abundance of this species and the overall abundance of fruiting trees (Pearson = +0.93, p < 0.03). Furthermore, the forests around SACHA and TRC were found to be relatively more mature and canopy cover less disturbed (Lloyd and Palomino, this publication), which is likely to benefit insect populations. Insects are an important variable in the diet of this species. Therefore at this stage we are still unable to determine whether traffic or fruit availability are most important factors affecting abundance of this species.
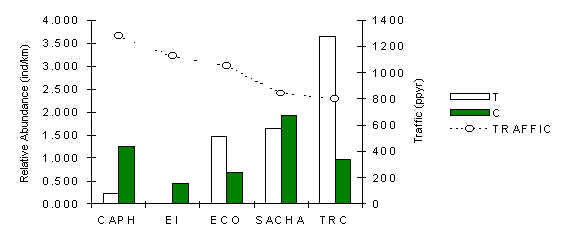
Figure 3.32. Relative abundance of the squirrel monkey.
South American Coati (Nasua nasua)
The high abundance of this species at SACHA does not suggest that this species is feeling any serious effects from hunting (Figure 3.36). The species was present at all lodges, although no consistent pattern between T and C abundance is evident. Average abundance within lodges and subsequent analysis revealed that there was no significant correlation between abundance and traffic (Pearson = -0.67). However, the two lodges with the lowest average abundance were CAPH and EI, which are also the oldest lodges in the area, and a very strong significant correlation was found when average abundance was regressed against the number of years the lodge had been in operation (p = 0.02) (Figure 3.37). So, on the macro scale this species appears to be sensitive to long periods of human presence, although it is unclear whether current traffic is affecting this species at the younger lodges. The large home range size of this species would have made it difficult to identify a consistent difference between T and C, if it exists, as any particular social group at a lodge would have a greater tendency to roam over both types of transects. It is also plausible to speculate that the species is naturally rare at CAPH and EI due to some unknown habitat variable.
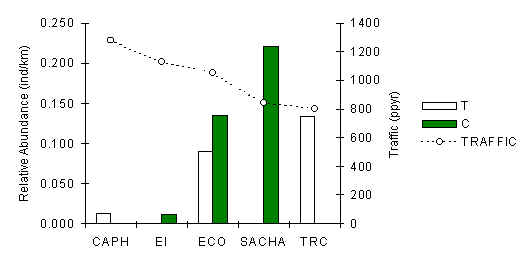
Figure 3.36. Relative abundance of the South American coati (Nasua nasua).
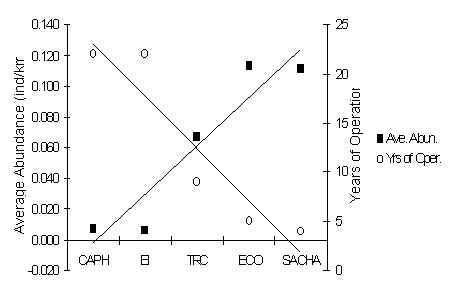
Figure 3.37. Relationship between average abundance of N. nasua at each lodge and years since the lodges began operating.
Similarity Between Lodges
The previous analyses have identified five species which are closely influenced by tourist traffic (brown capuchin, red brocket deer, bolivian squirrel, southern amazon red squirrel, and saddleback Tamarin). A hierarchical cluster analysis was used to combine the data from all of these species in order to determine if the trends between T and C were consistent across all lodges. To accomplish this the data for each species was first standardised, in order to reduce the importance of any one species, by calculating percentage abundance, i.e. T% and C%. The resulting cluster (Figure 3.34) did indeed show a complete separation between T and C, indicating that as a group these species are consistently affected by traffic across all lodges and would be candidates as tourism impact indicator species. A similar analysis but with the aim of isolating the similarities between lodges showed that the two lodges with the highest traffic were the most similar to each other (Figure 3.35).
EIC ------------------+
CAPHC ------------------+----+
+--+
SACHAC ---------------------+-+ +
ECOC ---------------------+ +--+
TRCC --------------------------+ +
+-----------------
EIT ------------------+ +
CAPHT ------------------+----+ +
+--+ +
SACHAT ---------------------+-+ + +
ECOT ---------------------+ +--+
TRCT --------------------------+
Figure 3.34. Dendrogram showing the relationship between T and C across all lodges based on % abundance of five species.
EI ---------------+
CAPH ---------------+---+
+--+
SACHA -----------------+-+ +
ECO -----------------+ +---------
TRC ----------------------+
Figure 3.35. Dendrogram showing the relationship between lodges as a whole, based on the pooled abundance (T + C - not converted to %) of the same five species.
Mammal Community Structure
Primates
The TRC had a full complement of primates for its locality, due to its relative isolation (Figure 3.43). The white-fronted capuchin although not observed during the census periods was registered during opportunistic encounters at this lodge. In general, the other four lodges situated near settlements, had significantly lower primate biomass than those at the TRC (Figure 3.38), this was particularly evident at SACHA and CAPH where both brown capuchin and red howler monkeys were scarce due to hunting. These results add further evidence to the argument laid down by Freese et al. (1982), that human disturbance and particularly hunting is the single most influential factor affecting monkey biomass in Amazonia.
The primate community structure of the two lodges where hunting is prevalent (SACHA and CAPH) is quite similar, although they differ from other lodges in that they are dominated by the smaller more reproductively efficient species, namely the saddleback tamarin and the squirrel monkey. These two species can cope well with the lower fruit availability at CAPH due to their diverse diets. Where hunting is low, or absent, the community is dominated by larger species, particularly the red howler monkey, brown capuchin monkey and black spider monkey (at TRC only). Interestingly EI is most similar to the TRC in terms of community structure, which suggests that the lack of hunting immediately around this lodge has been beneficial.
The Dusky-titi monkey is a very minor constituent of the community and it appears to favour areas of more disturbed vegetation or where bamboo is common, a finding that is consistent with other studies of habitat preference of this species in Tambopata (Warner 1999).
Although structurally the lodges appear to differ from one another a Paired t-test revealed that at none of them was there a significant difference between T and C in terms of biomass (Table 3.22). Interestingly fruit tree availability at each lodge is not strongly correlated with primate biomass, which further underlines the impact that hunting is having on the larger frugivorous species of the community.
Table 3.21. Reference data of species weights (kg); the � average adult body weight was calculated for social species where juveniles were commonly noted in the dataset; * the weight used to calculate relative biomass of each species; 1 Clutton-Brock et al. 1977, 2 Emmons 1984, 3 Robinson et al. 1986, 4 Ayres et al. 1991, 5 Mittermeier 1991, 6 Peres 1993.
| Species | Adult body weight (kg) | Average (kg) |
� of Average (kg) |
| Primates | . | . | . |
| Saddleback tamarin | 0.402, 0.363, 0.396 | 0.38 |
0.29* |
| Squirrel monkey | 0.671, 1.002, 0.803, 0.906 | 0.84 |
0.63* |
| Dusky titi monkey | 0.681, 0.802, 1.173, 0.704 | 0.84 |
0.63* |
| Red howler monkey | 7.002, 6.193, 7.005, 6.506 | 6.67 |
5.00* |
| Brown capuchin | 2.501, 3.002, 3.453, 3.705, 2.206 | 2.97 |
2.23* |
| Black spider monkey | 7.83, 8.506, 8.107 | 8.13 |
6.10* |
| Ungulates | . | . | . |
| Brazilian tapir | 1103, 1775 | 143.65* |
. |
| White-lipped peccary | 18.003, 28.565 | 23.28 |
17.46* |
| Collared peccary | 17.523, 12.005 | 14.76 |
11.07* |
| Red brocket deer | 26.103, 23.54, 15.005 | 21.53* |
. |
| Carnivores | . | . | . |
| Eira barbara | 3.983 | 3.98* |
. |
| Nasua nasua | 3.883, 3.004, 3.405 | 3.43 |
2.57* |
| Atelocynus microtis | 7.002 | 7.00* |
. |
| Leopardus pardalis | 10.462 | 10.46* |
. |
| Rodents | . | . | |
| Sciurus ignitus | 0.202, 0.383 | 0.29 |
0.22* |
| Sciurus spadiceus | 0.602 | 0.60 |
0.45* |
| Myoprocta sp. | 1.53 | 1.5* |
. |
| Dasyprocta variegata | 3.603, 4.205 | 3.90 |
2.93* |
Ungulates
Again, the TRC was the only lodge to have a full complement of ungulates for its location (Figure 3.42), which included the white-lipped peccary. At the other extreme, the two lodges with the greatest traffic (CAPH and EI) the collared Peccary and the red brocket deer were the only ungulates observed, and these made up similar percentages of the community at these lodges. Total ungulate biomass was greatest at the TRC (Figure 3.39). A paired t-test revealed that there was a significant difference between T and C in terms of ungulate biomass (Table 3.22) although the majority of the pattern was dominated by the red brocket deer.
Rodents
Rodent biomass was dominated at every lodge by the brown agouti (Figure 3.44). It was also evident that the green acouchi favoured the lodges with most traffic and was for all intents and purposes absent or very rare at the TRC and SACHA. Rodent biomass reached a maximum at CAPH (Figure 3.40). Overall the data revealed that biomass was greatest at the two lodges most affected by hunting, i.e. SACHA and CAPH suggesting that the rodent community has benefited from reduced predation pressure or reduced inter-specific competition brought on by higher hunting pressures. A paired t-test revealed that there was no significant difference between T and C in terms of rodent biomass at any lodge (Table 3.22).
Carnivores
The TRC had the greatest diversity of carnivore species, which included the relatively rare small-eared dog (A. microtis). The most common species at all lodges was either the coati or the tayra (Figure 3.45), species known for their more omnivorous even predominantly frugivorous diet. Carnivore biomass was greatest at SACHA (Figure 3.41), although the lodge with the greatest proportion of feline biomass was the TRC. When biomass data along T and C transects are combined both the TRC and SACHA stand out markedly above the rest. These two lodges are relatively new and have the lowest traffic associated with them. A Pearson correlation coefficient revealed that indeed carnivore biomass is strongly negatively correlated with traffic (Pearson = -0.9). A similar pattern was also evident with respect to the track abundance of the ocelot (Figure 3.19). These two lodges however are also the most mature in terms of fruit production, so the large coati and/or tayra populations at these lodges may be due to this variable. A paired t-test revealed that there was no significant difference between T and C in terms of carnivore biomass from one lodge to another (Table 3.22).
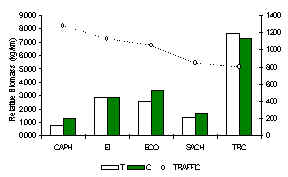
Figure 3.38. Relative primate biomass (kg/km).
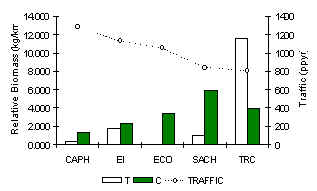
Figure 3.39. Relative ungulate biomass (kg/km).
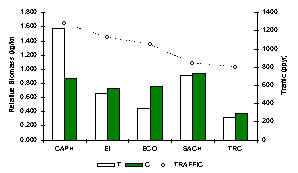
Figure 3.40. Relative rodent biomass (kg/km).

Figure 3.41. Relative carnivore biomass (kg/km).
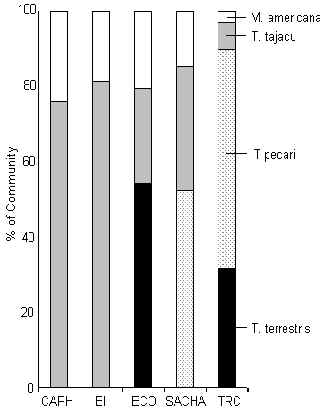
Figure 3.42. Ungulates.
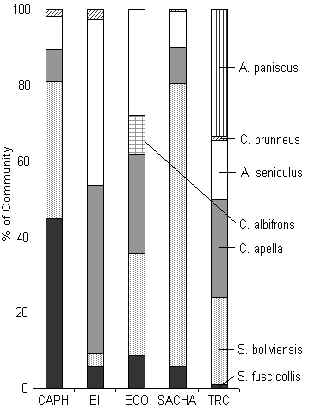
Figure 3.43. Primates.
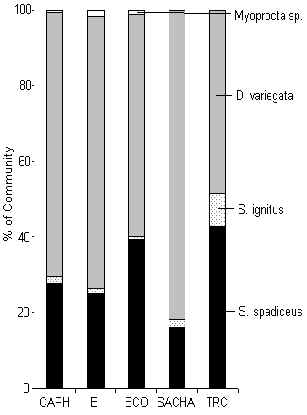
Figure 3.44. Rodents.
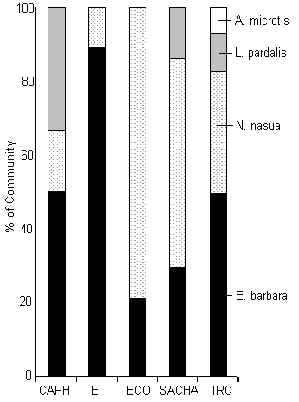
Figure 3.45. Carnivores.
Underlying mammal biomass at each lodge, i.e. a combination of the above four communities, reveal than the TRC has a healthy community of mammals (Figure 3.46). All other lodges have depressed mammal biomass in comparison, although the principal cause we conclude is due to historical hunting pressures associated with human settlements. No significant difference was found between T and C in terms of the overall biomass of mammals. The pattern is more closely associated with fruit availability and hunting pressure.
Table 3.22. Results of paired t-tests (1 tail) showing differences between T and C in terms of community biomass, * p < 0.05, + almost significant.
| Lodge | Primates |
Ungulates |
Carnivores |
Rodents |
All |
| No. of Species | 6 |
4 |
4 |
4 |
18 |
| Probability | 0.07 +C |
0.05*C |
0.46 |
0.40 |
0.16 |
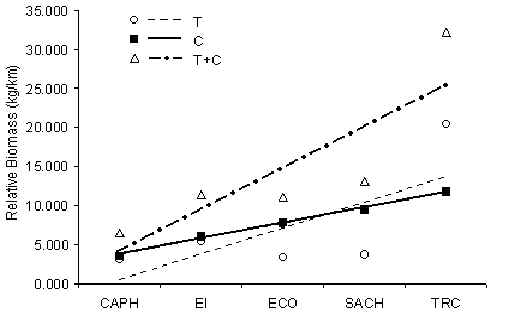
Figure 3.46. Trends in overall mammal biomass.