Trail-use Carrying Capacity
The concept of carrying capacity is an old one and dates from the time of Malthus in the 18th Century, when it was used to describe the issues relating to the capacity of the World’s resources to sustain an ever growing human population. For the purposes of this investigation we define the term Trail-use Carrying Capacity as "the capacity of wildlife communities, resident in a localised area of rainforest, to withstand tourists using trails within this area." We aim to use the results of this study to determine the trail-use intensity, above which wildlife appears unable to cope and beyond which abundance and community structure is likely to change.
To do this we only concentrated on those species that showed positive signs of being affected by traffic, i.e. species which have shown significant consistent differences in abundance between T and C transects (Brown capuchin, Red Brocket Deer, Bolivian Squirrel) and significant strong correlations between trail-use and abundance along T, where the abundance along C is on average lower and more stable than along T (Saddleback Tamarin, Southern Amazon Red Squirrel). These 5 species we term here Trail-use Carrying Capacity Indicators (TCCI). Our main assumption in choosing these species is that they all show significant signs that as traffic increases there is an increasing tendency for divergence between tourist and control areas in terms of the abundance of these species.
To determine the trail-use carrying capacity for each species, trend lines were introduced to characterise the T and C abundance data. Where the two lines cross is the point at which abundance along T = C. In the case of the Capuchin monkey, we omitted the data from CAPH and SACHA due to the obvious effects of hunting and converted the data into % abundance. In the case of the Bolivian Squirrel, we believe that the effects of traffic begin to be felt well below the minimum traffic value we tested (799 ppyr, TRC), and that at traffic values around that for CAPH the trend breaks down. Consequently we re-graphed this species omitting data for CAPH and converted to % abundance. The species’ profiles are re-graphed with their respective trend lines in Figures 3.47-51. The average convergence point for these 5 TCCI species was found to be 696 ppyr +/- 314 (Table 3.23).
This result should form the starting point in the process of identifying appropriate tourism management strategies concerning trail-use both for the lodges that were studied and for others in the area. Final acceptance of some form of trail-use carrying capacity will likely be affected to varying degrees by social, economic and political pressures associated with planning these strategies on a regional and a lodge to lodge basis. However, we strongly recommend that the effort is made to negotiate a suitable means of implementing some form of trail-use management, certainly, if lodges are serious in their claims or attempts to help reduce impacts on the local environment to a minimum and to some degree improve the wildlife spectacle offered to their visitors in the long term. The information provided here should be of help to this end. One possible management strategy is detailed in the recommendations section at the end of this report.
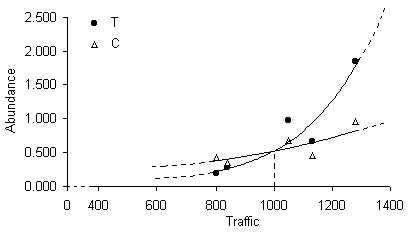
Figure 3.47. The trends in Tamarin abundance (T vs. C) illustrating the convergence point where T = C.
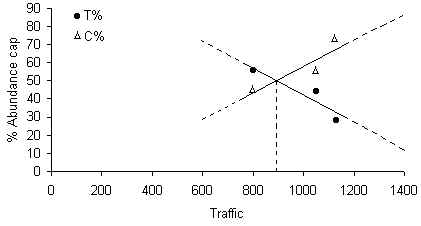
Figure 3.48. The trends in Brown capuchin abundance at lodges where hunting is negligible, (T% vs. C%) illustrating the convergence point where T% = C%.
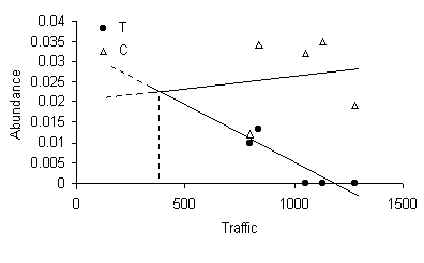
Figure 3.49. The trends in Red Brocket Deer abundance (T vs. C) illustrating the convergence point, where T = C.
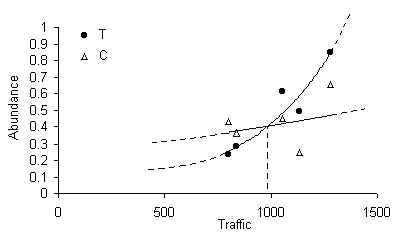
Figure 3.50. The trends in Southern Amazon Red Squirrel abundance (T vs. C) illustrating the convergence point, where T = C.
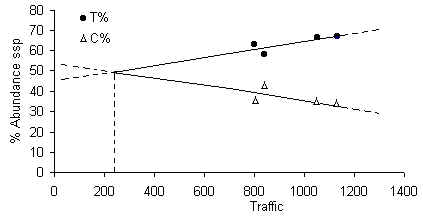
Figure 3.51. The trends in Bolivian squirrel abundance (T% vs. C%) illustrating the convergence point where T% = C% [Data from ECO has been ignored due to insufficient number of encounters].
Table 3.23. Results of convergence points.
| Species | Convergence Point (ppyr) |
| Bolivian Squirrel | 240 |
| Red Brocket Deer | 380 |
| Brown capuchin | 880 |
| Southern Amazon Red Squirrel | 980 |
| Saddleback Tamarin | 1000 |
| Average | 696 |
| 95% CI (+/-) | 314 |