|
|
|
Project Links
Last Updated: 12.07.2000 |
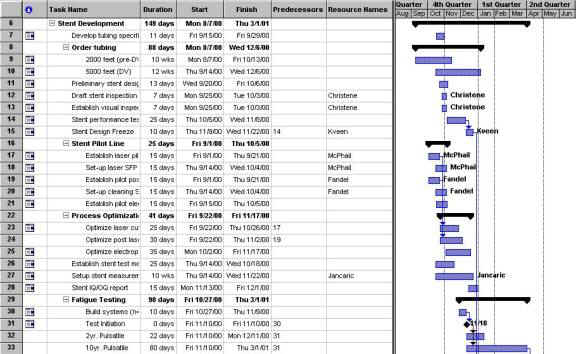
Our sample Project Management file described the design, development, and production ramp-up of the new stent product line at Boston Scientific, SciMed. The project started in August of 2000 and is scheduled to end in mid May, 2002. The schedule for this project was developed in Microsoft Project98. Since this project file was the first of its type (stent production) it was originally intended to serve as a template for future stent production. Much of the discussion on this file will discuss the file as it was used as well as how well it was created such that it could be used as a template for future use. The first step in using Microsoft Project is to determine the tasks required to complete the project. These tasks are broken down into manageable subtasks to form a work breakdown structure (WBS). The project WBS for this stent project (excerpt shown in Figure 1) is organized by phases rather than functions. Some of major phases include development, verification, marketing, and production. The WBS for the early phases is broken down to level 3 tasks, but some tasks go as deep as level 6. The later phases (Process validation, Regulatory, etc) of the project are only broken down to level 2. This is most likely due to the fact that these processes are not unique to stent production, each product at SciMed must go through these steps in order to receive FDA approval. As far as this particular project goes, this is adequate planning. The tasks that are broken down into level 6 seem to be a bit excessive or poorly organized (including Sterilize in level 6 under “pre-clinical tasks”). While this will be a task that will be needed for every stent built, it seems to be too specific. When this is made into a template in the future, they may want to re-organize this WBS and try to simplify the WBS. When task durations and dates are entered, the Gantt chart for the project is automatically generated. A small part of the Gantt chart is also shown in Figure 1 along with the WBS. It appears from the file that SciMed used mostly durations to schedule the tasks, and tried to stay away from “Hard Dates”. Additionally, there were some tasks that utilized the lag functionality of MS Project. Practically all milestones were linked with a certain amount of lag (acting as a buffer).
Figure 1: Project WBS and Gantt chart. SciMed uses task dependencies to organize and track progress of tasks as well as cut time when revising the schedule. These task dependencies are shown in the Gantt chart by arrows connecting tasks together. Creating these dependencies not only allows easy updating of the schedule, it also allows Critical Path analysis. However, many tasks in this Gantt chart were not linked to any other tasks. This created an interesting critical path, where patient comments were on the critical path while almost no manufacturing or design activities were on the path. This is because the manufacturing and design activities were only connected to each other, not into any other functional areas within the Gantt chart. A Pert chart is generated in MS Project when the WBS and Gantt chart are developed. Some of the tasks in this project are linked so MS Project automatically determines the critical path and displays it in red on the Pert chart. A small portion of the Pert chart is shown in figure 2.
Figure 2:
A small excerpt from the Pert chart Looking at this project file as a potential template for future projects, the lack of links and the “interesting” critical path is a MAJOR concern. Since I know for a fact that SciMed does do critical path analysis, using this file as a template would most likely result in failed projects. Before this project is used for that purpose, all tasks should be linked and a critical path analysis should be done to ensure the critical path is logical. Additionally, SciMed has attempted to use Resource assignments for many of the tasks. The Gantt chart has been formatted such that the resources assigned to a particular task are listed to the right of the task bar. Little care was taken in assigning resources and assuring that resources do not have other tasks due at the same time. The individuals assigned to various tasks are listed along with the WBS in the column labeled ‘Resource Names’. Only 20 of the 190 tasks and milestones have resources assigned, indicating that this feature was not used effectively. A sample of a resource allocation chart is shown in figure 3. The resource allocation charts show that the few resources assigned are over allocated.
Figure 3: Resource allocation chart. Most of the project’s resources are over allocated. I do not think that this portion of the file is unusable for a template. Since in a template, generally the resource names will be left blank to be filled in later, overlooking the task duplication is not a major issue. If SciMed wants to ease their integration of this Project file with their process (including the resources) they may want to assign tasks according to function, such as assigning a task to “Software Engineer” or “Senior Engineer”. Therefore it would be easier to assign resources to a new project using this template, plus it would aid in Human Resources planning as it could indicate how many people of each function are required at one time during the project. Overall, this project file seems to be more of a planning tool than a tracking tool, as no progress was input and no other tracking mechanisms were utilized (such as cost tracking). Therefore more work needs to be done in the actual planning of the project and linking the tasks. The file needs to be more interconnected, more solid in order for it to be used as a template. Certain tasks need to become more general, along with the resource names so as to accommodate a larger amount of projects. |