 .
. Again, we wish to compare the performance of two methods in ability to attain a quality characteristic x. But this characteristic is also affected by a noise variable whose effect we would like to eliminate from the experimental results. When there is a large difference between individual test results because of the change in the noise factor from test to test, the following procedure will be beneficial.
Let us call the old method A and new method B.
We do the experiment in pairs, ie, for the same value of the noise variable, we test method A as well as method B, with as little a time gap as possible between them.
Let (xA1, xB1), (xA2, xB2), ..., (xAn, xBn) be the n pairs of results.
Determine the differences between each pair dj = (xBj - xAj), j = 1, 2, ..., n. Calculate the average of the differences dbar = (d1 + d2 + ... +dn)/n, and the standard deviation of the differences Sd = SQRT[ (d1-dbar)2 + (d2-dbar)2 + ... + (dn-dbar)2 ].
Our aim is to improve x. If dB is less than 0, we give the benefit of doubt to the old method. If dB is greater than zero, how do we decide whether the new method better, or if the increase is just due to chance?
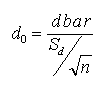
Hence we need to compare the average difference dbar with the change in method with the experimental error. By taking their ratio, we obtain the standardized difference as .
We compare this do with tcrit, the critical value of the t distribution from tables, choosing a level of significance alpha (commonly 0.05) and the appropriate degrees of freedom n-1.
If do > tcrit, we can conclude that the new method is significantly better than the old.
Example:
An article in the Journal of Strain Analysis (1983 Vol. 18, No.2) compares several methods for predicting the shear strength of steel plates. The data comparing the Karlsruhe method (first) with Lehigh method (second) are: (1.186, 1.061), (1.151, 0.992), (1.322, 1.063), (1.339, 1.062), (1.200, 1.065), 1.402, 1.178), (1.365, 1.037), 1.537, 1.086), and (1.559, 1.052). We would like to determine whether the results from the Lehigh method are significantly higher.
The differences are 0.119, 0.159, 0.259, 0.277, 0.138, 0.224, 0.328, 0.451, and 0.507. The average of the differences dbar = 0.273556 and the standard deviation of the differences is 0.13556 . Therefore, the standardized difference do = 0.273556/[0.13556*SQRT(9)] = 6.0539 .
Comparing with tcrit = t0.05, 8 = 1.860, we can conclude that the results from the Lehigh method are significantly higher.
Reference:
Montgomery, Douglas C., and Runger, George C., "Applied Statistics and Probability for Engineers Third Edition", John Wiley & Sons Inc, 2003, pp.349-351.