Fantasy Baseball 2002 Graphical Wrap-Up
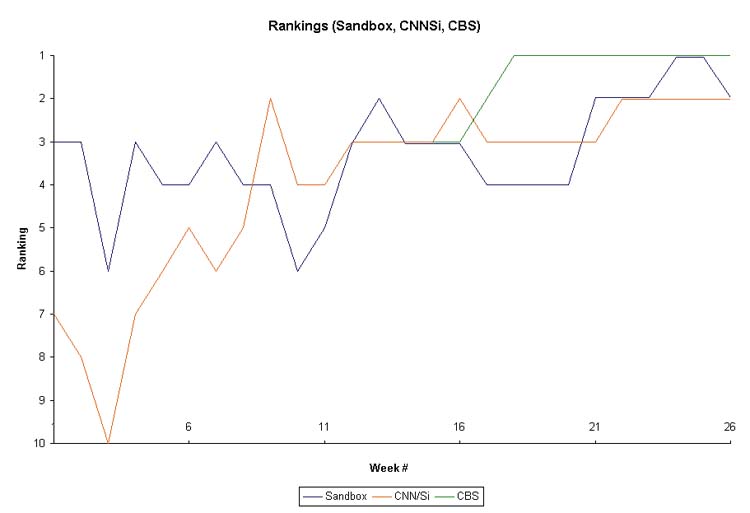
I got off to a slow start in Sandbox and CNN/Si. I had a good second-half, except for slipping to 4th in Sandbox for a couple weeks.
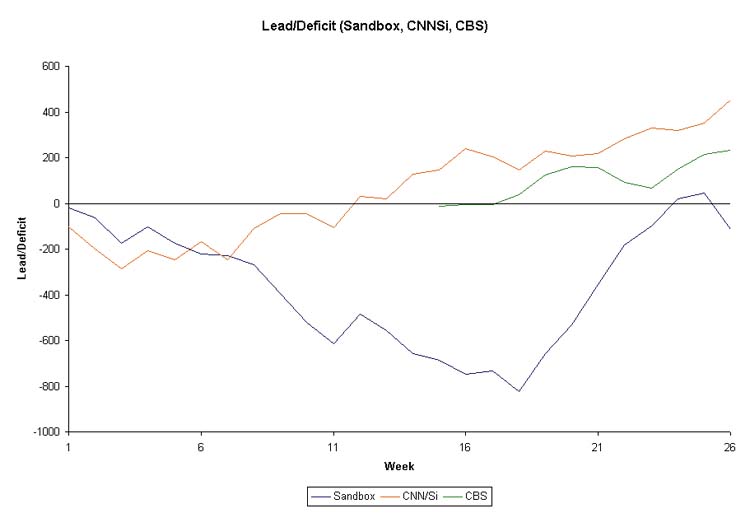
You can see how a made a strong surge in Sandbox after the people ahead of me used up all their pitching extremely early. In CNN/Si and CBS, I extended my point lead virtually every week.
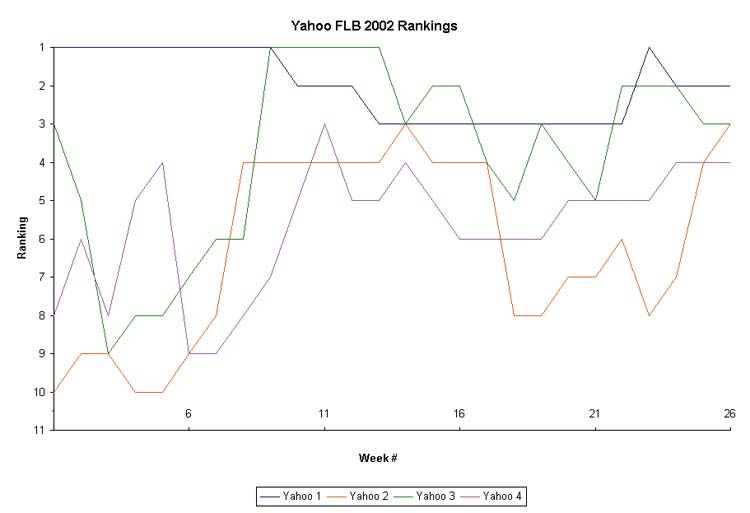
I led Yahoo #1 for the first 2 months of the season. I honestly thought it would be a run-away, so I got complacent.
I made some respectable progress in Yahoo #2 & #4 the last 2 months of the season, but I had put myself in too big a hole to recover.
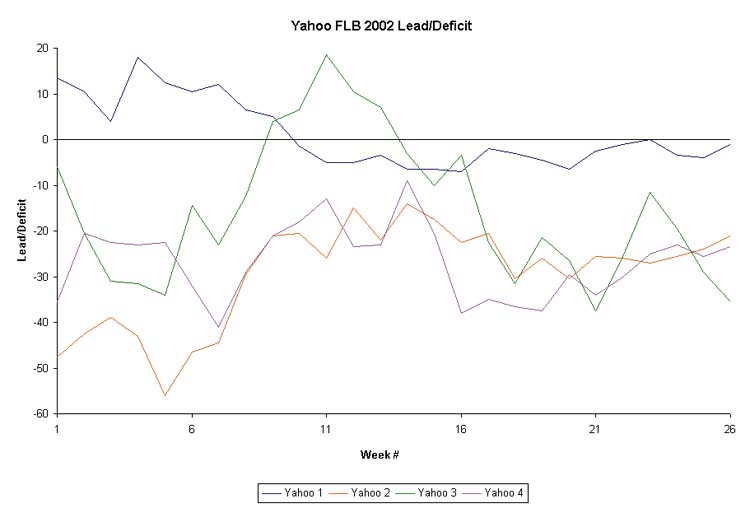
You can see my frustration as I was within 5 points the whole season in #1.
I got off to a bad start in #2 and just stabilized at about 25 points behind after two months.
In #3, I had a nice run around May-June that saw me rise from 30 back to 20 ahead and then fall to 30 behind by August. Pretty amazing.
You can see that I never contended in #4, just getting within 10 points once.
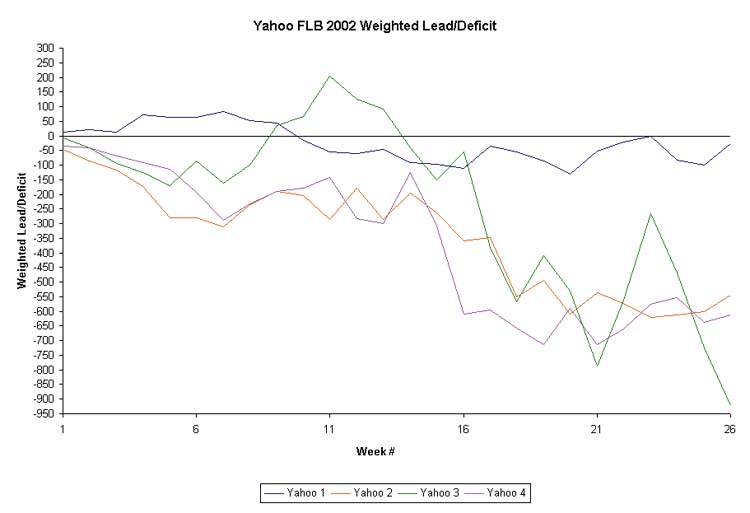
This is the same as the above graph except I multiply the lead or deficit by the week number to reflect the fact that it becomes more difficult to make a come-back as the season wears on. The most interesting feature is that #2 shows how I am really falling further behind when I am only holding steady in the rankings.