 |
|
|
|
|
|
|
|
|
|
|
|
|
|
|
|
|
NZ Housing Graphs |
|
|
|
I have compiled some charts and graphs to get an idea of what is really happening in the New Zealand housing market and thought I would make them available here to veiw for those who are interested. |
|
|
|
 |
|
|
|
This graph compares the actual median house price (REINZ) against the consumer price index (Reserve Bank) and household income index (Statistics NZ). It shows just how high prices have become since 2002 compared to incomes and general inflation. |
|
|
 |
|
|
|
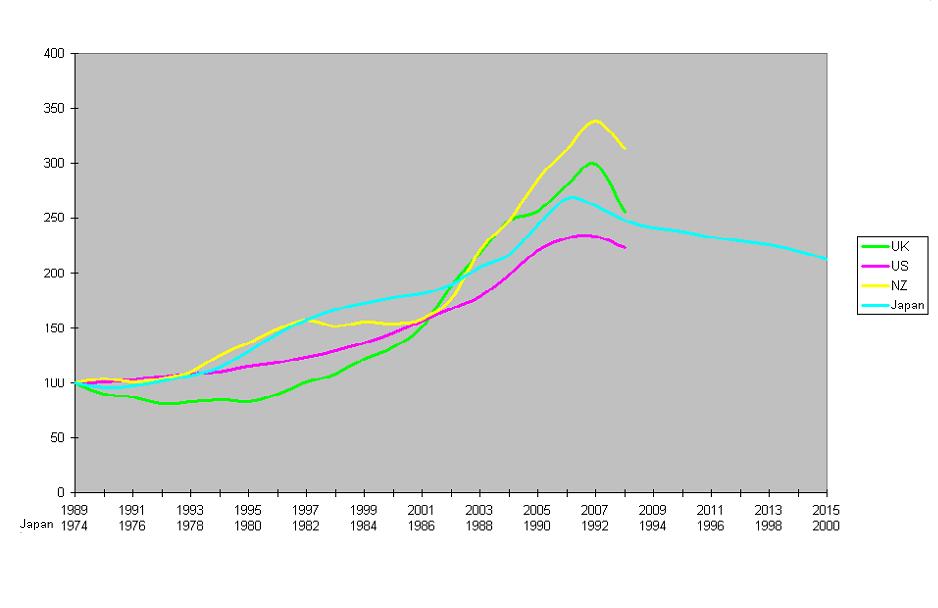
I compiled this graph to get an idea of how the NZ housing bubble compares to USA and the UK. I also thought it would be interesting to see how the Japanese housing bubble in the eighties compares. I have set the base year at 1989 for NZ, UK and USA the base year is 1974 for Japan. All examples start at 100. You can see the price growth of the NZ housing bubble is steeper and higher than all of them.
So far prices have fallen from peak:
USA peak 234 in 2007 to 223 a 4.7% fall so far
NZ peak 338 in 2007 to 314 a 7.1% fall so far
UK: peak 299 in 2007 to 243 a 18.7% fall so far
Japan peak 268 in 1991 to 212 in 2000 a 21% fall over 9 years .They are still falling, the index in 2008 is 154 thats a 42% drop over 17 years and showing no signs of stopping is this what is going to happen to our housing market?
Here are the links for the data sources:
New Zealand- Reserve bank QVNZ house price index
USA- Office of Federal housing enterprise oversight house price index
UK - Nationwide house price index
Japan- Statistics Bureau Urban land price index residential
|
|
|
 |
|
|
|
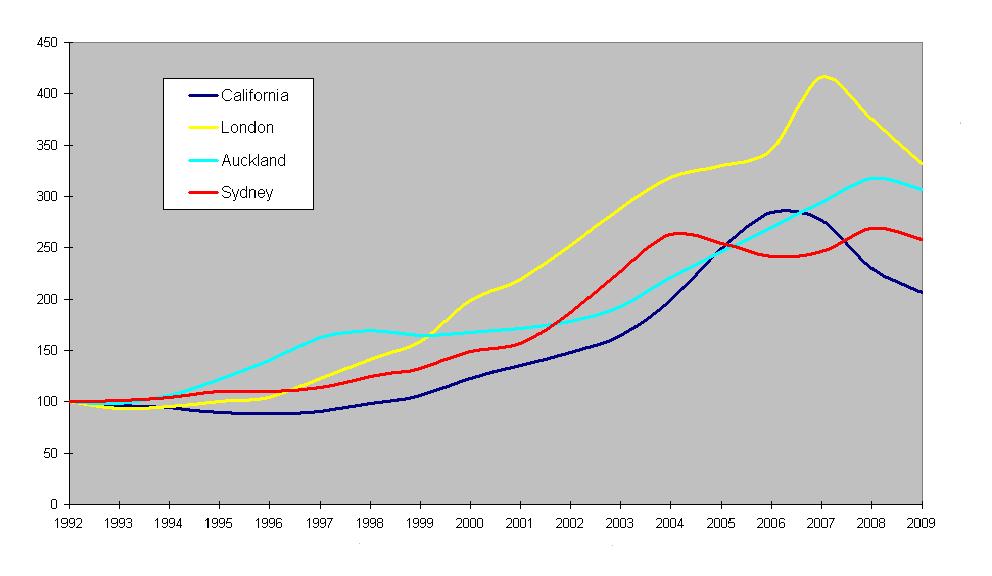
This graph compares the housing bubbles in California, London, Auckland and Sydney. Londons housing bubble shows the biggest increase, prices have fallen 20.1% from peak in 2007. California has fallen 27.4% from its peak in 2006. Sydneys prices have been flat since 2004. Auckland house prices peaked in 2008 and have fallen 3.4% so far (REINZ). Data for this graph is from the same sources as previous. Sydney's index comes from the Australian Statistics Bureau
Next Page
|
|
|
|
  |
|