|
SC 207 - Term Paper |
Introduction | |
|
1. Introduction 2. Related
Work 3. Comments 4. References |
About Topic This article implies that increasing process maturity decreases effort required to develop the software product. By using a 161-project sample, the author tried to segregate the effects of process maturity versus other effects. By either using Software Capability Maturity Model (SW-CMM) level done by an organized evaluation or by interviewing someone familiar with the project, the Process Maturity ( PMAT ) rating for each project was recorded (Table 1). The Cocomo II model was then used to calculate the effort required at each PMAT level. The results concluded that a 1 level change in PMAT could result in a 4-11 percentage reduction in effort. Relation to SC207 This article is an introduction to SC207. Even though process maturity was not covered in SC207, it is very vital to reduce development effort. Even in labs, process maturity is not easily realized as it cannot be achieved by doing one project. It comes over time from lessons learnt from previous project documentation and mistakes. Research on past documents closely related to my SC207 project helped make my project development easier.
New Contributions This article does not give any new contribution to the World of Software Engineering. On the other hand, it shows the importance of Software Engineering in today's fast paced world. It proves with facts, the importance of process maturity.
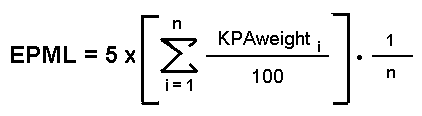
Elaboration The effects of process maturity alone is not easy to determine as an organization tends to make improvements in other areas as well. Therefore a mathematical model( Cocomo II ) is used to illustrate the effects of process maturity against other factors like product factors, platform factors, personnel factors and project factors. Two methods were used to collect data for computation. SW-CMM was used for project which were already rated with the SW-CMM's published definitions. Level 1 of the SW-CMM was split into level 1 lower and upper halves. Lower half was for organizations which depended on heros and did not follow process and documenting lesson learnt while upper half consisted of groups which have implemented most of the key processes which would qualify them to be in level 2. The second method uses the Equivalent Process Maturity Model (EPML) rating which was derived based on the percentage of compliance for each Key Process Area(KPA) goal of the organization. This was done by interviewing someone on the project. Each of the KPAs had 7 rating levels( based on Likert scale ) but the last 2 levels were excluded while computing. Table 2 shows the relationship between the KPA level, Likert scale and the weight assigned. The equation below gives the calculation of EPML.
Table 1 was used to convert the EPML calculated to a PMAT level. The data analyzed came from 161-projects from 18 sources. The data included product sizes in KLOC ( thousands lines of code ) and project effort in person-months( a person-month is 152 hours ). This project effort is measured as the period of project from completion of project analysis to the end of integration and testing. A full calibration of the Cocomo II Model was used to reveal that an increase in process maturity would lead to a decrease in development effort. The equation below gives a simplified model of the Cocomo II Model used in the analysis.
The PMAT was found stronger at explaining differences in actual project data effort when it was used as an exponent to the project size( B in the equation ). Table 1 contains the corresponding numerical value for each PMAT level. The analysis result was given a 95% confidence interval as the data collected was not precise. Even then, the result confirmed that process maturity reduced the effort by 3% to 15%. The average reduction for 2 to 1000 KLOC project would be between 4% to 11%. Furthermore this study also showed the influence of process maturity versus other influences on development effort. Through this the total percentage a factor can influence effort, going from the lowest to the highest factor rating, was derived. On the average, a 100-KLOC project would have a PMAT productivity range of 1.43. This implies that the effort required to develop the project can be reduced by 43% by a transition from the lowest PMAT level to the highest.
|
