You can modify the chart to eliminate grid, change color, change
the legend, and do anything until you feel it's right. In addition to suppressing
the legends, I will add text boxes now. In order to add a textbox, select
Text Box on the drawing toolbar.

Once you click on the text box icon and move the cursor over the chart, you will find the cursor has a different look. Place the cursor where you want to make a text box, hold the mouse key, drag the cursor, and release the mouse key to make a text box of your preferred size. Now enter the text in the box. 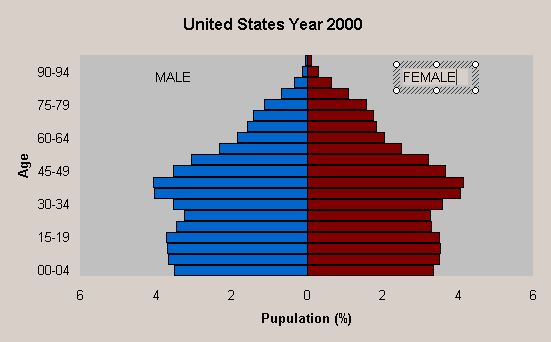
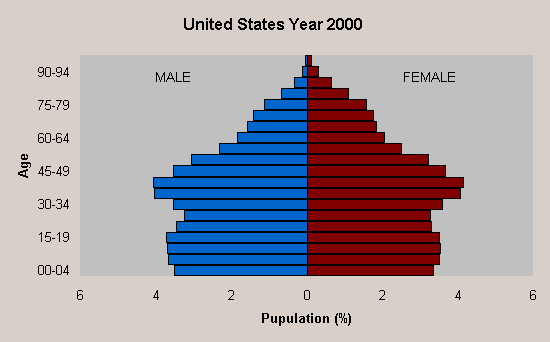
See? It's easy, isn't it? Now it's your turn to create your
pyramid.
|