A Decrease in Demand
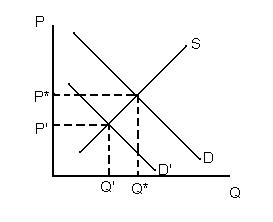
To see how the procedure outlined in Shifting Demand operates consider the market for condensed soup during the winter months. The graph below shows the initial equilibrium at the intersection of the supply curve, S, and the demand curve, D. This initial price- quantity pair is designated as Q* and P*. Assume that the outside temperature has risen because we are now moving into the summer months. Because the temperature outside is warmer people have substituted away from condensed soup towards salads (they are substitutes). This causes the demand for condensed soup to fall. This is designated by the movement of the demand curve to the left from D to D'. The new intersection is at Q' and P'. Looking at the graph we see that price fell from P* to P' and that quantity fell from Q* to Q'. From the graph we can see that a decrease in demand causes both price and quantity to fall.
A Decrease in Demand
![]()
![]()