|
If you�re looking to get into the stock market, you�ll need to know how to read the stock list. The stock list is merely a table that lists vital information on a stock so you can decide if it is a good buy or not. The top of the list looks something like this.
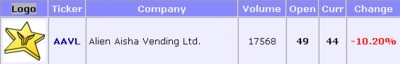
Logo: The icon or avatar of the company. Many companies have the same logo, for some reason.
Ticker: The initials of the company.
Company: The company�s name.
Volume: How many shares of that company have been bought all together.
Open: What the stock was worth at 12:00am NST.
Curr: What the stock is worth right now.
Change: The percentage change since 12:00am NST. A green number means it has gained value, a red number means it has dropped in value, and a black number means there has been no change at all.
Some Examples:
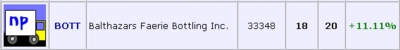
This stock was worth 18np at 12:00am NST. It is currently worth 20np. The green +11.11% means the stock has gone up 11%
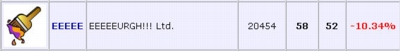
This stock was worth 58np at 12:00am NST. It is now worth 52np. The red -10.34% means the stock has dropped 10%.
Your Portfolio
When you buy a stock, a �lot� is created in your portfolio. A lot lists what stock you bought, how many shares, and what it�s current value is. You can have multiple lots of the same stock. For example, if you bought five hundred shares of BB today, you would have one lot of BB. If you bought another five hundred tomorrow, you would then have two lots of BB, and so on. Now if you bought 250 shares of BB and 250 shares of AAVL today, you would have two lots. If tomorrow you buy 250 shares of BB and 250 shares of TSRC, you'll have four lots total. The BB's do not combine - each transaction is separate.
Here's what a lot looks like:
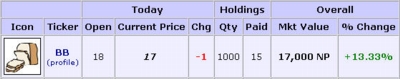
Icon: Displays the avatar of the given company. Many companies have the same icon. No one really knows why.
Ticker: This is the abbreviation or initials of the company. In the above image, BB stands for Breadmaster Bakeries. These are used to identify as stock quickly without having to type out the entire name.
Open: This is what the stock was worth at 12:00am NST.
Current: What the stock is selling for right this minute.
Chg: How many points the stock has gained or lost since 12:00am NST.
Qty: How many shares are in this lot.
Paid: How many Neopoints you paid per share.
Mkt Value: The current value of the lot.
% Change: Percentage of how much the stock has changed since you bought it. Red means it has gone down, green means it has gone up, black means it hasn�t changed at all.
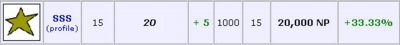
This stock is currently worth 20np, gaining five points since 12:00am - a 33% gain. You bought 1000 shares at 15np each. Now the stock is worth a total of 20,000np. (If you sell now, you make 5000np)
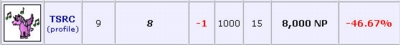
This stock dropped a point since 12:00am - and seven points since you bought it. That�s a 46% decline. Even though you bought 1000 shares at 15np, this lot is only worth 8,000np. (If you sell now, you�ll lose 7,000np.)
General Tips:
- Buy your shares in multiples of 100. It makes the math easier.
- If you're new, sell your stocks when they've made a 100% profit. There will be a green 100% in the last column.
- Never sell your shares if the stock is "in the red".
|