Silicon Dicarbide
Mike Geusic, Michael Geusic, M. E. Geusic
IIV. SPECTROSCOPIC INVESTIGATIONS OF SILICON DICARBIDE
A. Introduction
Silicon dicarbide was first observed54 in 1926 in the spectra of certain cool carbon stars although not identified at this time. Some thirty years later in 1956, the carrier of the 4980 A band system was tentatively identified as SiC2 by Kleman55. Using a silicon charged graphite tube of a King furnace heated to over 2500 K, he was able to obtain spectra proving that the carrier of this band system was due to a compound consisting of only silicon and carbon. Based on a partial vibrational analysis, Kleman postulated the molecule to be linear SiCC and suggested it to be the analog of 4050 A cometary spectrum of C3 56.
Subsequently, a matrix isolation study by Weltner and McLeod57 was carried out. They trapped vapors from a hot oven in cryogenic neon and argon matrices, obtaining both optical and infrared spectra that supported previous conclusions. But their vibrational assignment was somewhat different than that of Kleman. Next, Verma and Nagaraj58 reported an improved gas phase study obtaining an absorption spectra using a flash discharge technique. From their vibrational analysis they also were in agreement that silicon dicarbide was linear SiCC. Most recently, Bondybey59 re-examined the 4980 A band system using laser vaporization to produce SiC2. This band was investigated both in the gas phase and matrices being probed by laser-induced fluorescence along with absorption in the matrix. From the observed spectra, Bondybey agreed with the previous structure (due to a lack of any evidence to the contrary) , although a reassignment of the vibrational spectra was proposed. He also pointed out that the linearity of SiC2 was not a priori obvious.
A theoretical study by Green60 was done in an effort to establish whether the linear SiCC configuration was correct. Using a self-consistent field (SCF) calculation he concluded that the ground state should be linear SiCC with a closed shell 1Σ+ electronic structure, agreeing with previous experimental results. In this publication he also pointed out that in a recent radioastronomical observation of the molecular envelope of the evolved carbon star IRC + 10216, unidentified lines in the millimeter-wave region needed to be investigated. He observed that these lines were not harmonically related as would be the case for rotational transitions in linear molecules. But, he suggested that they have a pattern reminiscent of b-type transitions as in a bent symmetric structure such as might be postulated for CSiC.
In light of what has been presented above, Michalopoulos and I felt the re-investigation of SiC262 under high resolution (so that the rotational structure could be analyzed) was necessary in order to determine the true structure of silicon dicarbide. This study has been carried out and will be presented within. Also mentioned will be the negative results of a similar spectroscopic investigation of SiC whose search was actually the initial intent of these studies.
B. Experimental
The technique used for the production of SiC2 is the same as described earlier. The target sample used was a polycrystalline silicon carbide rod (99.9% pure, Atomergic Chemetals Corp., Plainview, N. Y.). In this case, the vaporization laser was the second harmonic of a Nd:YAG focused to a .1 cm spot, and operating at 60-70 mj 's per pulse. The predominant species in the beam were seen to be Six (x=1-6), SiC2, Si2C, Si3C, Si2C2, and Si2C3 using the F2 excimer laser line (7.98 eV). Silicon carbide was present but only in very small quantities (less than 1% of SiC2). Resonant two-photon ionization (R2PI) was used with mass selective detection to record the visible absorption spectra of SiC2 in the 4980 A.region. The origin band (0-0) was rotationally resolved by inserting a pressure tuned intracavity etalon, narrowing the dye laser line width to .05 cm-1 FWHM.
In this study, it was also necessary as will become apparent shortly, to reheat the rotational temperature of the molecular beam so that higher lying rotational transitions could be observed. In a supersonic jet it is a simple matter to adjust the rotational temperature by decreasing the backing pressure of the nozzle. Although, when using this laser vaporization technique, it is important that the helium density above the target is as high as possible in order to efficiently produce clusters. Therefore, the decrease in backing pressure normally used would be unsatisfactory. A solution to this problem was found to be the use of a short tube mounted on the end of a pulsed nozzle source. The tube used was 5 cm long with 1 cm internal diameter and mounted co-axial along the beam axis. The carrier gas expanding into this tube reflects off the walls and causes turbulence in the flow. The effect of the turbulence is to reheat the gas before expanding out of the 1 cm diameter orifice. Under these conditions, the final rotational temperature is found to be somewhat higher (15 K) than expansion from the normal nozzle orifice. The rise in temperature depends on the length and diameter of the reheat tube.
C. Selection Rules
In this study of silicon dicarbide, information pertaining to the bond lengths and geometry was obtained through probing one-photon rovibronic absorption spectra using two-photon ionization. If the molecule was linear and asymmetric, as thought for the past thirty years, then the selection rules given in Chapter III, Section C would apply. This transition 1Π <-- 1Σ would be expected to show a rotational structure consisting of a P, Q and R branch for the origin (0-0) rovibronic transition.
Although, if the molecule were bent, it would be an asymmetric top. A transition between two different electronic states will be allowed by the oscillating electric field of light, if and only if, the matrix element63,64
Me'v'e"v' = ∫ Y'*esvrdY"esvrdtesvr = ∫ Y'*vr Y"vr dtvr ∫ Y'*es deY"es dtes
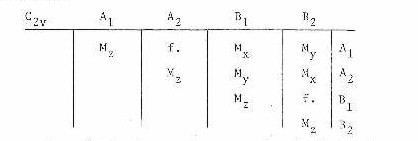
is different from zero. Here the single prime indicates the upper of the electronic states. In the preceding discussion, it has been assumed that the geometry of the molecule is the same in both the electronic states involved. Therefore, for an allowed transition the product Y'e*M Y"e must be symmetric (A1) with respect to the symmetry elements of the point group. As an example, for the point group of C2v it can be shown that the product of Y'e*M Y"e will be symmetric depending on the electronic symmetries and the orientation of the dipole moment.
The species of the electronic states involved are given on the top and right hand side of the table. A transition between any two states can be seen to be allowed or forbidden (f.) depending on the orientation of the dipole moment (Mx, My, Mz). This same type of table may be constructed for any other point group. If the electronic states have different symmetries, then only the common symmetry element of these point groups must be considered.
From the transition moment integral, the selection rules for a rovibronic transition of an asymmetric top can be seen to be (for non-multiplet state)63,64
1). The spin multiplicity cannot change.
ΔS=0
Singlet<--------->Singlet
Triplet<--------->Triplet
Singlet<----l---->Triplet
2). An electronic transition is orbitally allowed, if and only if,
∫ Ye'*d Ye"dte is non zero
(An electron transition is orbitally allowed if the triplet direct product
Γ(Ye'*) x Γ(de ) x Γ(Ye")
contains the totally symmetric irreducible representation of the point group of the molecule.)
3). Vibronic transition is allowed, if and only if, the integral
∫ Ye*'Yv*'d YeYv dtev is non zero.
4). The rotational quantum number change may be at most, one
ΔJ=0 , +l (with the restriction J=0 <----l---->J=0)
5). Combination of the level of a given J value of one electronic state with those of a given J value of another electronic state are subject of restrictions depending upon the symmetry properties of the asymmetric top rotational eigenfunctions.
If the transition moment is in the direction of the a-axis, only the transitions
+ + <---> - + and + - <---> - -
can occur.
If the transition moment is in the direction of the b-axis, only the transitions
+ + <---> - - and + - <---> - +
can occur.
If the transition moment is in the direction of the c-axis, only the transitions
+ + <---> + - and - + <---> - -
can occur.
If the transition moment does not lie along one of the principal axes, then the selection rules are determined by which components along the axes are non zero. Although, even in the most general case, transitions between levels of the same symmetry are forbidden.
+ + <----l----> + +
- - <----l-----> - -
+ - <----l-----> + -
- + <----l-----> - +
The symbol s ++ , - + , etc. are determined by the behavior of the rotational eigenfunctions with respect to 180° rotation about the c and a principal axes, repsectively.
6). The overall (rovibronic) species must not change
A <-------->A , B <-------- > B
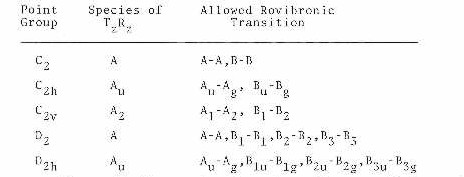
For the overall species based on the full symmetry group, the product of the overall species of the upper and lower states must be the product TzRz of a translation and a rotation. This is shown below for a few point groups.
Along with these selection rules, there are factors which modulate the intenstiy of the individual vibrational and rotational lines within an electronic transition. For the vibrational bands, the intensity is proportional to the Franck Condon factor. The rotational lines within a particular vibrational band also have a modulation in their intensities which are given by Cross65.
Consideration of nuclear spin63,64 can also have an effect on the intensity of the rotational levels depending on symmetry of the molecule. In the case of silicon dicarbide, the point group is C2v and interchange of identical carbons with zero nuclear spin around the a-axis will lead to an intensity alteration between the A and B rovibronic species. The ratio of the intensities between the A and B rovibronic levels can be shown to be (I+1/I). Therefore, in this case the B rovibronic levels will be nonexistent.
D. Results
In order to determine the geometry of SiC2, a high resolution scan of the (0-0) origin band of the SiC2 A<--- X spectrum, found at the 4980 A region, was obtained under normal expansion conditions. Figure 15 shows the observed rotational structure of this band.
Figure 15
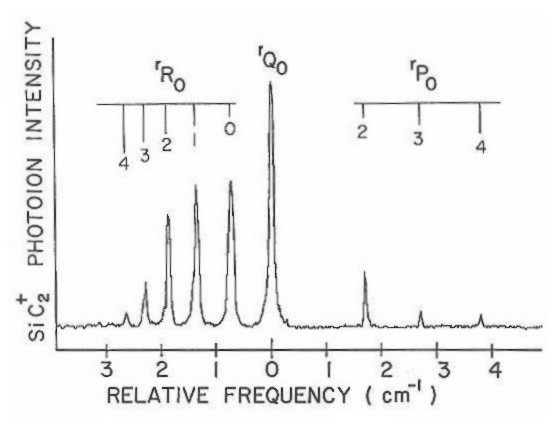
This spectrum corresponds to a plot of photoion intensity of 28SiC2 versus the frequency of a pressure-tuned dye laser. A similar spectrum was observed simultaneously for both 29SiC2 and 30SiC2 minority isotopic species. The low natural abundance of these species resulted in such a weak spectra that accurate rotational line measurement could not be made. These spectra have therefore not been presented here. Although, the observed isotopic shifts of these species support the assignment of this band as being the origin (0-0) transition.
In examining the spectra shown in Figure 15, it is seen to be exactly what would be expected for an 1Π <---1Σ transition in a linear molecule. There is a strong Q branch, and the R branch is more intense than the P branch. In trying to fit the spectrum to the model64
F(J' ,J") = B'J' (J' +1) + .5qJ' (J'+l) -B"J"(J"+l)
the rotational constants and quanrtum numbers follow the standard notation. The (+) sign in front of the lambda doubling term is used for the Q branch, while the (-) sign is used for both the P and R branches. One finds the calculated constants such as the lambda doubling parameter and bond lengths to be somewhat odd. The actual fit is reasonable, but the lambda doubling parameter is .043 cm-1 which is 100 times greater than in C3 (which is known to be linear), and both the Si-C and C-C bond lengths are extremely short (1.0-1.2 A).The shortness of these bond lengths could be explained if one assumes that the geometry of SiC2 is linear and symmetric (C-Si-C). The interchange of equivalent carbon with zero nuclear spin would eliminate alternate rotational levels in the 1Σ ground state. This would lead to reasonable bond lengths but whose actual fit to the model is rather poor. From these facts the linearity of silicon dicarbide was dismissed leaving the explanation that its geometry is that of an asymmetric top.
The cold spectrum (5 K rotational) in Figure 15 was then submitted to a fit for the model of an asymmetric top. As shown, it turns out that this band is really the r-form (ΔK=+1) subband from K"=0 in a perpendicular transition of an asymmetric top which is near the prolate top limit. The fit to this model was good and the larger lambda doub1ing parameter becomes a normal K-doubling due to the asymmetry splitting of K'=l levels of the excited state.
If the rotational constant A of this asymmetric top is fairly large, then the levels belonging to higher K" values would not be expected to be populated at the very low rotational temperatures. So, in order to test the model further and to obtain more rovibronic lines for analysis, the jet reheat tube discussed earlier was put in place. Figure 16 shows the spectra of the origin (0-0) band under these conditions. The rotational temperature in this figure is estimated to be I5 K. This more extended scan now shows the expected p and r form bands due to the increased population of the higher K" levels in the rotationally heated SiC2.
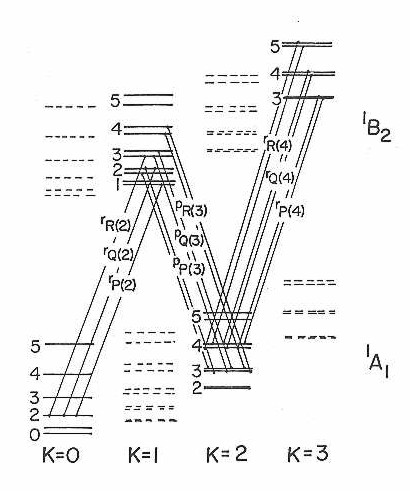
In fitting this higher rotational temperature spectrum it was found that these new subbands do not arise from the next higher K" level. These features can be explained by the fact that they originate from K"=2. The correct assignments are shown in Figure 16 and diagrammed on a schematic energy level chart in Figure 17. Examination of a number of spectra similar to that presented were analyzed, but revealed no evidence of subbands originating from K"=l or K"=3. The reason for missing odd K" levels can only be understood if the two carbon atoms in this molecule are equivalent and are interchanged by rotation about the a-axis. In a near prolate asymmetric top, interchange of identical nuclei with zero nuclear spin by rotation about the a-axis would produce an alternation in the K structure.
Figure 16
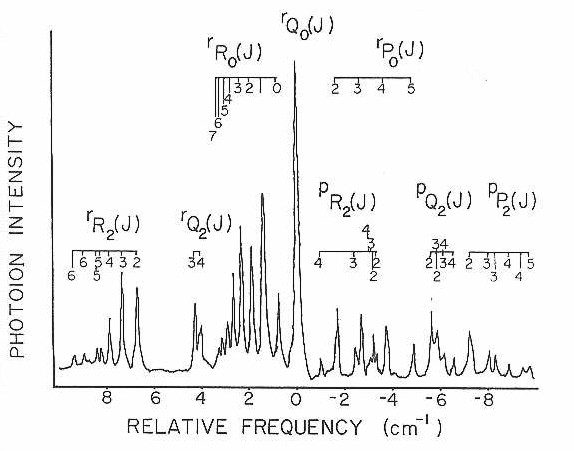
Figure 17
With the data from these fits it is evident that the ground state is of C2v geometry as shown in Figure 18. Here, the two principal axees of the inertial tensors are marked, with the third being perpendicular to the plane of the paper.
In Table IV are presented the measured line positions for the 15 K rotational spectrum. Also tabulated here are the measured relative intensities of each transition and their assignment. Each line is labeled both with the conventional J subscript K prolate, K oblate asymmetric top labels and the appropriate prolate symmetric top labels (since the molecule is a very near prolate symmetric top as seen by the Rays asymmetry parameter41 K=-.87).
All lines from Table IV were submitted to a nonlinear least squares program66. This program calculated the asymmetric top eigenvalues and eigenfunctions in the ground and excited states by direct matrix diagonalization of the rigid rotor Hamiltonian in the prolate symmetric top limit. The fit resulted in the measurement of rotational constants in the ground and excited states along with the band origin. With the rotational constants and fact that the two carbons are equivalent (with rotation around the a-axis), the bond lengths and angles were calculated and are presented in Table V.
Figure 18
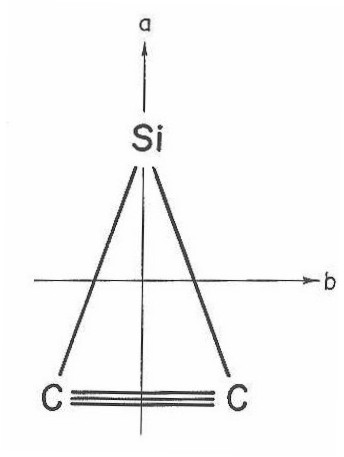
Table IV
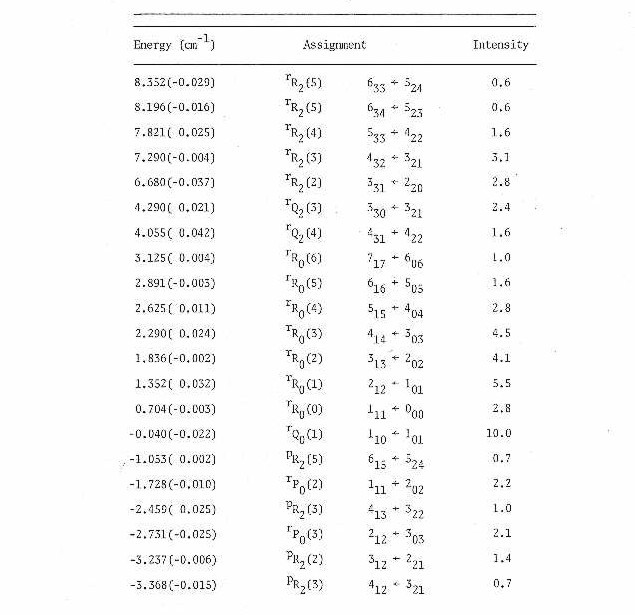
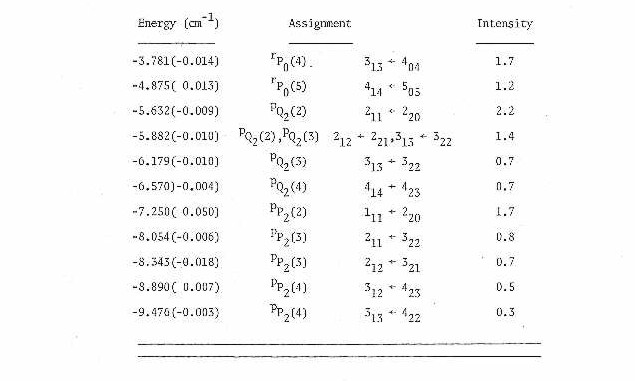
Table V
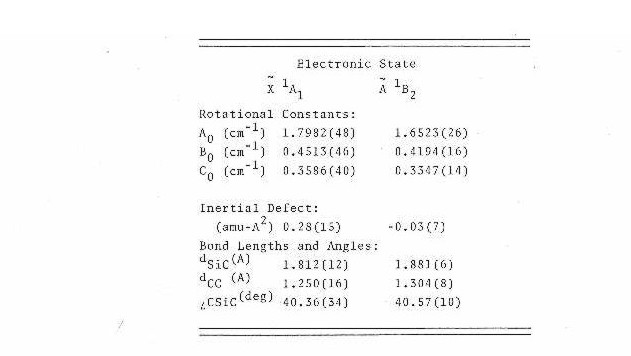
The 1.25 A C-C bond length in the ground state is close to that for a C-C triple bond while the 1.30 A in the excited state is approximately that of a C-C double bond. This would suggest that the transition is an Π*<---Π on the carbon- carbon triple bond.
From the fit the r-form subband, originating from K"=0 and terminating in K'=l of the excited state, is seen to go to the upper of the two K' doublet levels for the Q branch transition, and the lower for the R and P branch transitions. This determines that the transition moment lies along the inertial b-axis of the molecule. If one assumes the ground electronic state symmetry to be 1A1 then the selection rules require an excited electronic symmetry of 1B2 in the point group C2v.
E. Conclusion
Silicon dicarbide has been shown to be an asymmetric top in the near prolate symmetric top limit which is not in agreement with previous researches. The ground state of this molecule is best described as a silicon atom bound to the side of triply bonded carbon atoms, forming a planar triangular molecule of C2v symmetry. If the ground state is assumed to be 1A1 the selection rules require the excited electronic state symmetry to be 1B2 in the C2v point group. The transition moment is seen to be polarized along the inertial b-axis of the molecule and the transition is best understood as a Π*<---Π excitation on the carbon-carbon triple bond.
During the analysis of this spectrum ab initio calculations of SiC2 were carried out by Grev and Schaefer67 in a cooperative effort to understand the spectrum observed. These calculations showed the linear configuration to be the most stable. However, a series of calculations which show the triangular geometry to be increasingly stabilized relative to the linear form at successively higher levels of theory, were also achieved. Although, even at their highest level, the 1A1 triangular form is just barely more stable than the linear form and is still calculated to be a transition state rather than a true minimum. This SCF optimized calculation though is in good agreement with our experimental results.
The suggested explanation of Green60 concerning the unidentified lines in the reported radioastronomical observation of the evolved carbon star IRC + 10216, in fact, turns out to be correct. A recent publication by Thaddeus et al.68 shows the original SiC2lines plus the other unidentified lines can be explained by silicon dicarbide being an asymmetric top. Also, with their more accurate measurement they have determined our constants to be approximately 3% high.
One might also consider the possibility that the linear configuration of SiCC is also present in the molecular beam, but no evidence for its existence has been seen. Scans to both higher and lower frequencies of the origin band were carried out. No other spectral features (within 5% of the intensity of 1B2<--- 1A1 origin) were observed other than the already reported 4980 A band system. This of course, does not completely rule out the linear configuration. It is certain that the spectrum of SiC2 previously reported is from the triangular species. In Bondybey' s59 recent assignment , the bending frequency should be increased by a factor of two since there is no prohibition against single quantum transition for a molecule of this geometry.
An ionization potential of SiC2 has been bracketed to lie between 8.91 and 10.38 eV. These limits were determined by the fact that photoion production from this excited state could not be observed when the ionization photon was ArF 6.4 eV, whereas, it was observable with F2 7.98 eV.
As mentioned earlier, this study actually had the initial intent of spectrally investigating SiC. Scans both in the visible and ultraviolet were carried out using resonant two-photon absorption, although no spectral information was obtained. This result could be explained in two ways.. The first is that SiC is not formed to any substantial amount making the spectral signal extremely weak, or secondly, the combined energies of the excitation and ionization photons may not have been, in fact, energetic enough to produce photoions. In Bondybey's59 study of SiC2, he also reported the absence of spectral features of SiC using laser induced fluorscence which indicates that the first explanation is more likely.
Additional information concerning Silicon Dicarbide can be found here