Demographers will sometimes take two individual human traits and see if there is any connection between them.
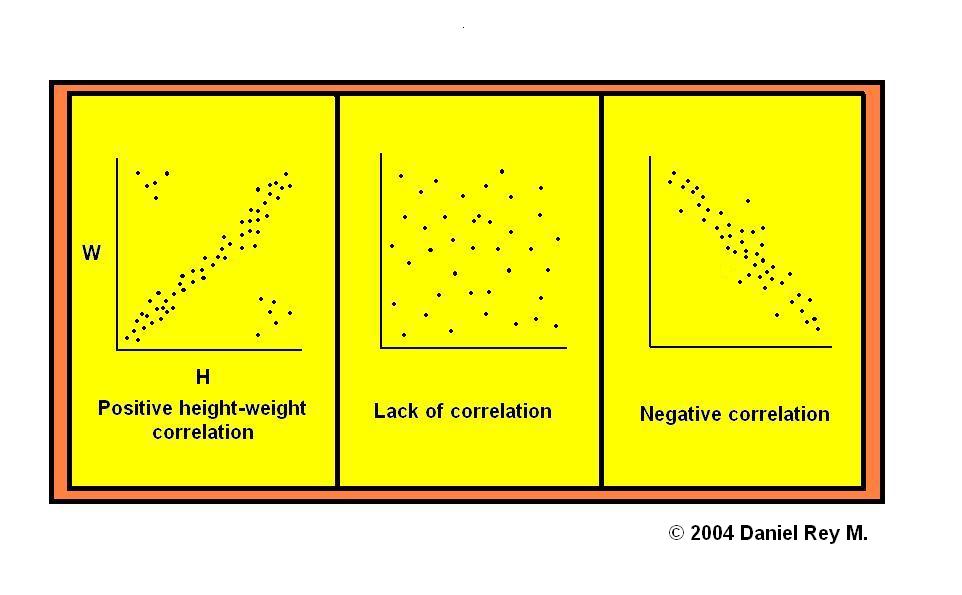
For example, if height and weight --astronomers are fond of this example, or else they are too busy to try and come up with some other one, so why should anybody else?-- are plotted on a graph one would expect to find that tall people are heavier than short people. This turns out to be true in most cases. Nearly all the dots will show up in a certain area of the graph, rather than scattered at random all over (and displaying no pattern that would suggest some kind of nexus), so that high values of one of the variables are associated with similarly high values of the other one, and low values, with low values.
This is a "correlation" between two variables, as it is called in statistics. Here it happens to be a "positive" one. An increase in one quantity or measure is linked to a corresponding increase in the second one, and the same holds for decreases. The points will fall along a narrow patch stretching diagonally between the lower left-hand corner and the opposite corner, up and to the right.
In a "negative" correlation it is the other way around: if one variable increases then the other one decreases. The points will gather along a band going from the upper left-hand corner to the lower right-hand corner. This scattering is the mirror image of the previous one.
At a glance, then, one can tell whether or not two individual characteristics that are quantifiable (they can be either counted or measured) are linked, and, if there is such a link, whether they change in the same direction, increasing or decreasing together, or in opposite directions (if one of them increases the other one decreases, and if the former decreases the latter increases).
So the average person falls within a certain area in the height-weight diagram, yet there are exceptions, and they will appear elsewhere on it. Short, heavy individuals (fat, too, inevitably, otherwise they could in no way be both short and heavy) will occupy the upper left-hand corner and tall, light ones (and quite skinny, inescapably, for they cannot otherwise be both tall and light) the opposite ditto.
Thus ends an awful raid on the Wastelands of Statistics. Tragically, it had to be done, but at least it was hasty. Only now can one safely go for the stars, and survivors, if any, might want to keep moving onward, upward, and outward, into the Inky Chasm.
III
No one can point a finger at astronomers and call them a bunch of radicals. On the contrary, by nature they seem to be conservative. They tend to hold on to the past.
An example is the stellar magnitude scale. It is old enough to be termed "ancient". Someone put it together two thousand years ago, when all one could possibly count was the stark-naked-eye stars. Besides, the brightest were assigned the smallest number, mag 1, the dimmest were given the biggest, a six. Some say this is confusing and ought to be the other way around. Anyway, it now needlessly makes equations more complicated. (It makes it necessary to use negative exponents in one case, in order to accomodate the fact that magnitude values go up as brightness falls.)
When the time came to discard this system or patch it up, they patched it up. Negative magnitudes were added on the lower end so that brighter things could be included, like planets, exploding stars, approaching comets and asteroids, and the Sun and Moon (and now [wo]man-made objects too). Additional positive ones were placed on the other end to be able to include telescope stars, too faint to be perceived without instruments.
"Planetary nebulae" are another example. They were given that name by the first astronomers who photographed them, using small telescopes. They thought these objects were quite like planets. Then it was realized that they had nothing whatever to do with planets or anything of the sort, yet the name remained. Again tradition was shown due respect.
...and yet another: one of the six parameters, or "elements", of an orbit is still called the "argument" (e.g.,of perihelion). The term is still used, strictly for historic reasons.
There might have been a good excuse for keeping the scale, though. Modern instruments, oddly, showed that the brightest stars placed on it happened to be precisely 100 times as bright as the faintest, or nearly so. Maybe they sensed an Invisible Hand behind this prodigy, like Adam Smith, and acted accordingly, out of fear and/or reverence. (This is one really wild guess.)
To be fair (...).
Go to Page 3