 |
|
|
|
|
|
|
|
|
|
|
|
|
|
|
 |
|
|
|
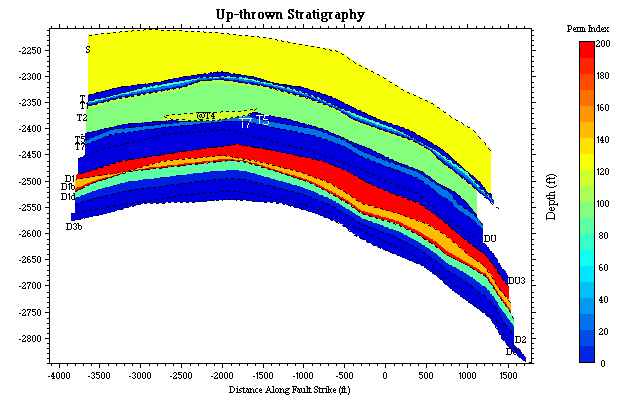
The up-thrown wall of the studying fault. Horizon lines are superposed for clarity. Note the channel deposit labeled @T4. It incised T2, T5, and T7 intervals. Colors represent permeability index, as is measured by the color bar on the right. |
|
|
|
 |
|
|
|
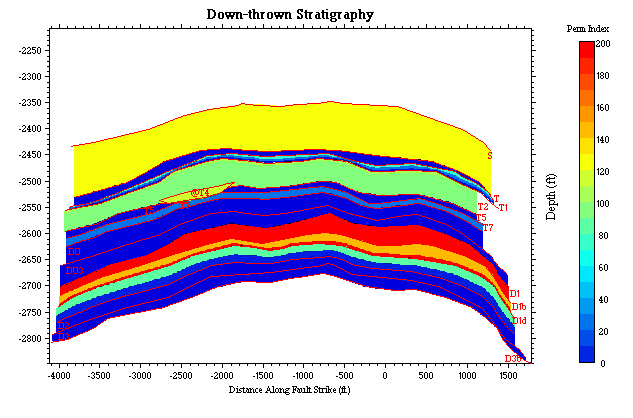
Stratigraphy on the down-thrown wall of the studying fault. The same channel sand deposit is denoted by @T4. Refer to the color bar on the right for the permeability index property index the colors represent. |
|
|
|
 |
|
|
|
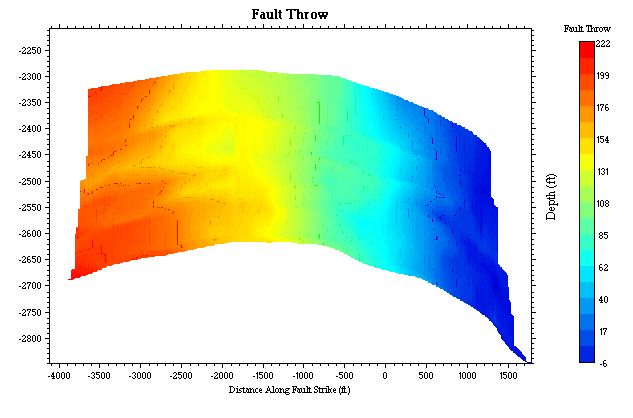
Magnitude of throw on the fault studied. One tip of the fault is on the right. See the color bar for scale. |
|
|
|
Dr.Seal Home Horizons Fault Seal |
|