(source: USGS, 2000)
Source: Holbrook, 2002
| Seismic Profiles | ||||||||||||||||
| A few examples of seismic profiles and their interpretation. | ||||||||||||||||
|
||||||||||||||||
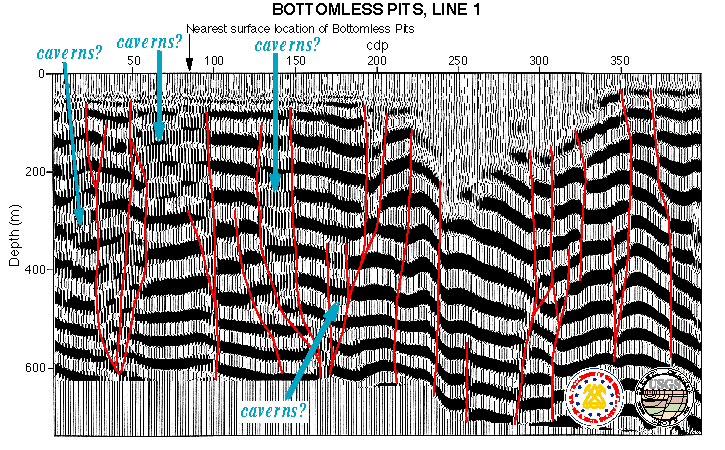
| Fig 1 - An example of high-resolution seismic reflection imaging of faults and subsurface caverns. The seismic reflection image is of Line 1 at the Bottomless Pits. The horizontal axis is common depth points (for distance multiply by 1.25), and the vertical axis is depth in meters. The red lines infer faults and fractures in the Kaibab Limestone and the underlying units. These fauls can be mapped at the surface where Kaibab Limestone is exposed. The fault at about CDP 240 is the graben bounding fault. Areas lacking coherent reflections and labeled �cavern?� are believed to be extensions of the large subsurface cavern system known as Bottomless Pits. The roof of the cavern system is only about 25 ft below the surface at the surface opening to the cavern. The near-surface area that is not imaged from about CDP 225 to CDP 325 occurs because shot points were not located along the steep side of the hill. (source: USGS, 2000) |
||||||||||||||||
|
||||||||||||||||
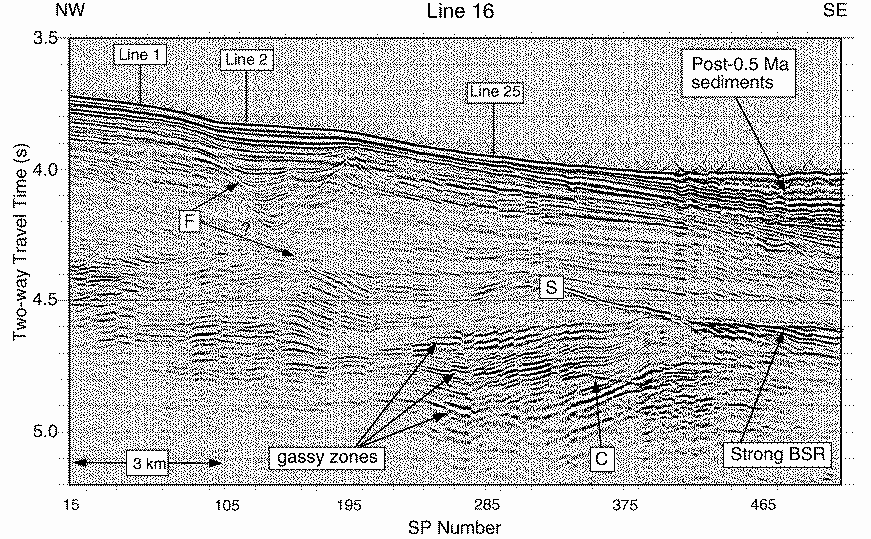
| Fig 2 - Single-channel seismic profile in a proposed 3D survey area, shot with 105/105 GI gun. Shot spacing is 30 m. Bright reflections beneath �0.5 s below seafloor are interpreted as gas-charged zones. Gas distribution shows strong lateral and vertical variations. Note (1) pervasive high angle faulting throughout section; (2) more shallowly dipping fault (F) in hydrate stability zone; (3) strong (recently formed?) bottom-simulating reflector (BSR) beneath area of thick post-0.5 Ma sediments; (4) stronger reflection (S), which may be free gas within hydrate stability zone; and (5) a reflection (C) that cross-cuts stratigraphy beneath the BSR, which may be a gas-charged low-angle fault, a diagenetic horizon, or an out-of-plane reflection. Source: Holbrook, 2002 |
||||||||||||||||
| Home | ||||||||||||||||