|
Filtration is an important step in the production of polymer fibers and films. Impurities present in the polymer can have a negative effect on the final products mechanical properties such as strength, toughness, and modulus. Engineers utilize porous media to minimize the amount of impurities in an extruded product. These impurities impede the melt flow through the porous media, thereby reducing production rates and increasing production expenses. CAEFF researchers developed a computer program that simulates flow through
a porous filter medium. Numerical modeling of flow through porous filter
media requires the description of fluid flow by a computer model that relates
fluid velocity field and pressure distribution. The objective of
this research project was to collect experimental data to refine the simulation's
distribution functions and create a graphical user interface for the filtration
model that calculates the dynamic debris deposition. This was accomplished
by analyzing filtration media obtained from DuPonts Chattanooga facilities,
developing copper and nylon 6,6 particle size and shape factor distribution
functions, and using MATLAB® to improve the programs user-friendliness.
DuPont supplied porous filtration media that had been used in the production
of polymeric materials. The media included mesh screens and filter beds
of varying porosities, contaminated with copper and gelated nylon particles.
The mesh screens had been treated at DuPont with hot nitrogen to remove
excess polymer. Two circles from each screen were punched out for analysis.
Three commercial pack filter beds consisting of layered sintered metal
(steel powder) were each cut into three cross sections with a water-cooled
blade to prevent the formation of additional gelated particles.
The project was divided into three separate tasks: copper and gelated nylon 6,6 particle analysis, distribution function development, and graphical user interface development. The copper particle analysis was conducted with a visible light optical microscope. The appropriate magnifications were determined to be 3.5X for the 325 mesh screen and 10X for the 200x1400 mesh screen. First, each magnification had to be calibrated using a scaled slide to measure in micrometers. Micrographs of three different locations were taken for the 325 mesh screens and four different locations for the 1400 mesh screens. The brightness and tint of the micrographs were then altered to improve the contrast between particles and background. The particles were traced manually and the micrograph was converted into a binary color image. The average diameter, maximum diameter, minimum diameter, area, and perimeter were measured and the number of particles determined. The gelated particle analysis was conducted with an ultraviolet light optical microscope. The appropriate magnifications were determined to be 3.5X and 6.3X. First each magnification had to be calibrated using a scaled slide to measure in micrometers. Micrographs of eight different locations were taken for the 6.3X and six different locations for the 3.5X. The particles were traced manually. The average diameter, maximum diameter, minimum diameter, area, and perimeter were measured and the number of particles determined. Experimental data obtained from all analyses were formulated into Excel
spreadsheets and two distribution functions were developed. The particle
size distribution functions were generated by first sorting the average
particle diameters in ascending order and determining the maximum and minimum
average particle diameters. The minimum particle diameter was subtracted
from the maximum, and the resulting value was divided by the number of
desired ranges (70 for copper and 50 for nylon) to obtain the range width.
The number of particles in each range was counted and then plotted against
an average particle diameter range in the form of a bar graph. To develop
the shape factor distribution function, the shape factor for each particle
was calculated using the equation
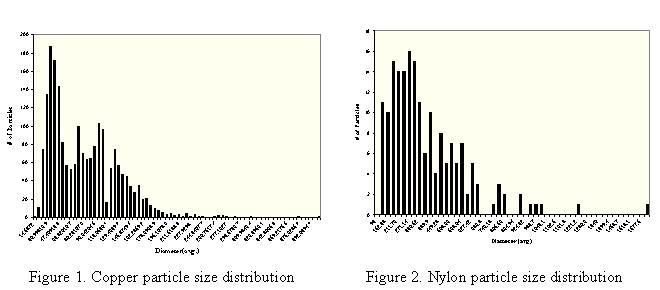
The analysis of the mesh screens and filter beds proved that copper
particles exist in large amounts within the polymer melt. The copper particles
varied in shape, and size ranged from 14.59 397.51mm. Figure 1 shows
that copper particles were more abundant in smaller diameter ranges (15-30mm).
Fewer gelated nylon particles than copper particles were accumulated.
It was determined that gelated nylon 6,6 particle location within the filter
bed depended on filter section depth. Nylon particles ranged in size
from 93.96-1578.70mm. The gelated nylon particle distribution function
is skewed towards smaller size particles as shown in Figure 2.
 The GUI enhances the usability of the filtration simulation. The enhancements
are
 After analyzing the copper and gelated nylon particles, it was concluded that the nylon particles were bigger than the copper particles, but the copper particles were more abundant than the gelated nylon particles. These data assisted in the creation of the particle size and shape factor distribution functions, which will help the computer model predict the debris deposition and distribution more accurately by replacing the distribution curve currently incorporated in the filtration model. The user friendly enhancement (graphical user interface) created for the filtration model successfully executes the program and reduces user interference with code. The interface will allow DuPont researchers to input process conditions to customize the simulation. DuPont will be able to use such predictions to prolong the life of spin packs and improve the cost efficiency of the filters. Additional research on filter beds will likely result in a further refinement of the debris particle distribution functions.
|