This project started from a discussion with a friend named Tom Browne that I met on the internet. After debating several issues, Tom challenged me to design a crossover for his current digital speaker project so he could compare the differences with his own IIR digital crossover design. I was keen to try out some ideas that I had, and saw it as a good chance to gain experience with DSP crossovers before starting a project of my own.
The following drivers are used in this project:
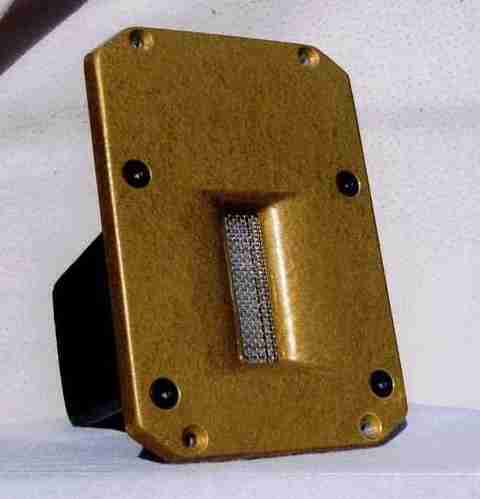
Tweeter: Howard Dawson HRL-1 Ribbon Tweeter - image
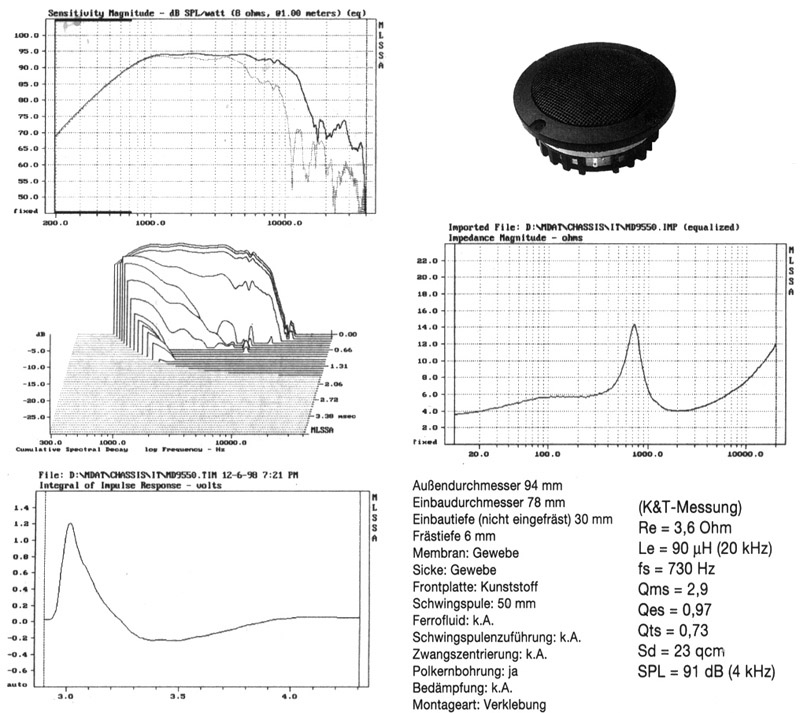
Midrange: Intertechnik MD9550 2" dome - data sheet
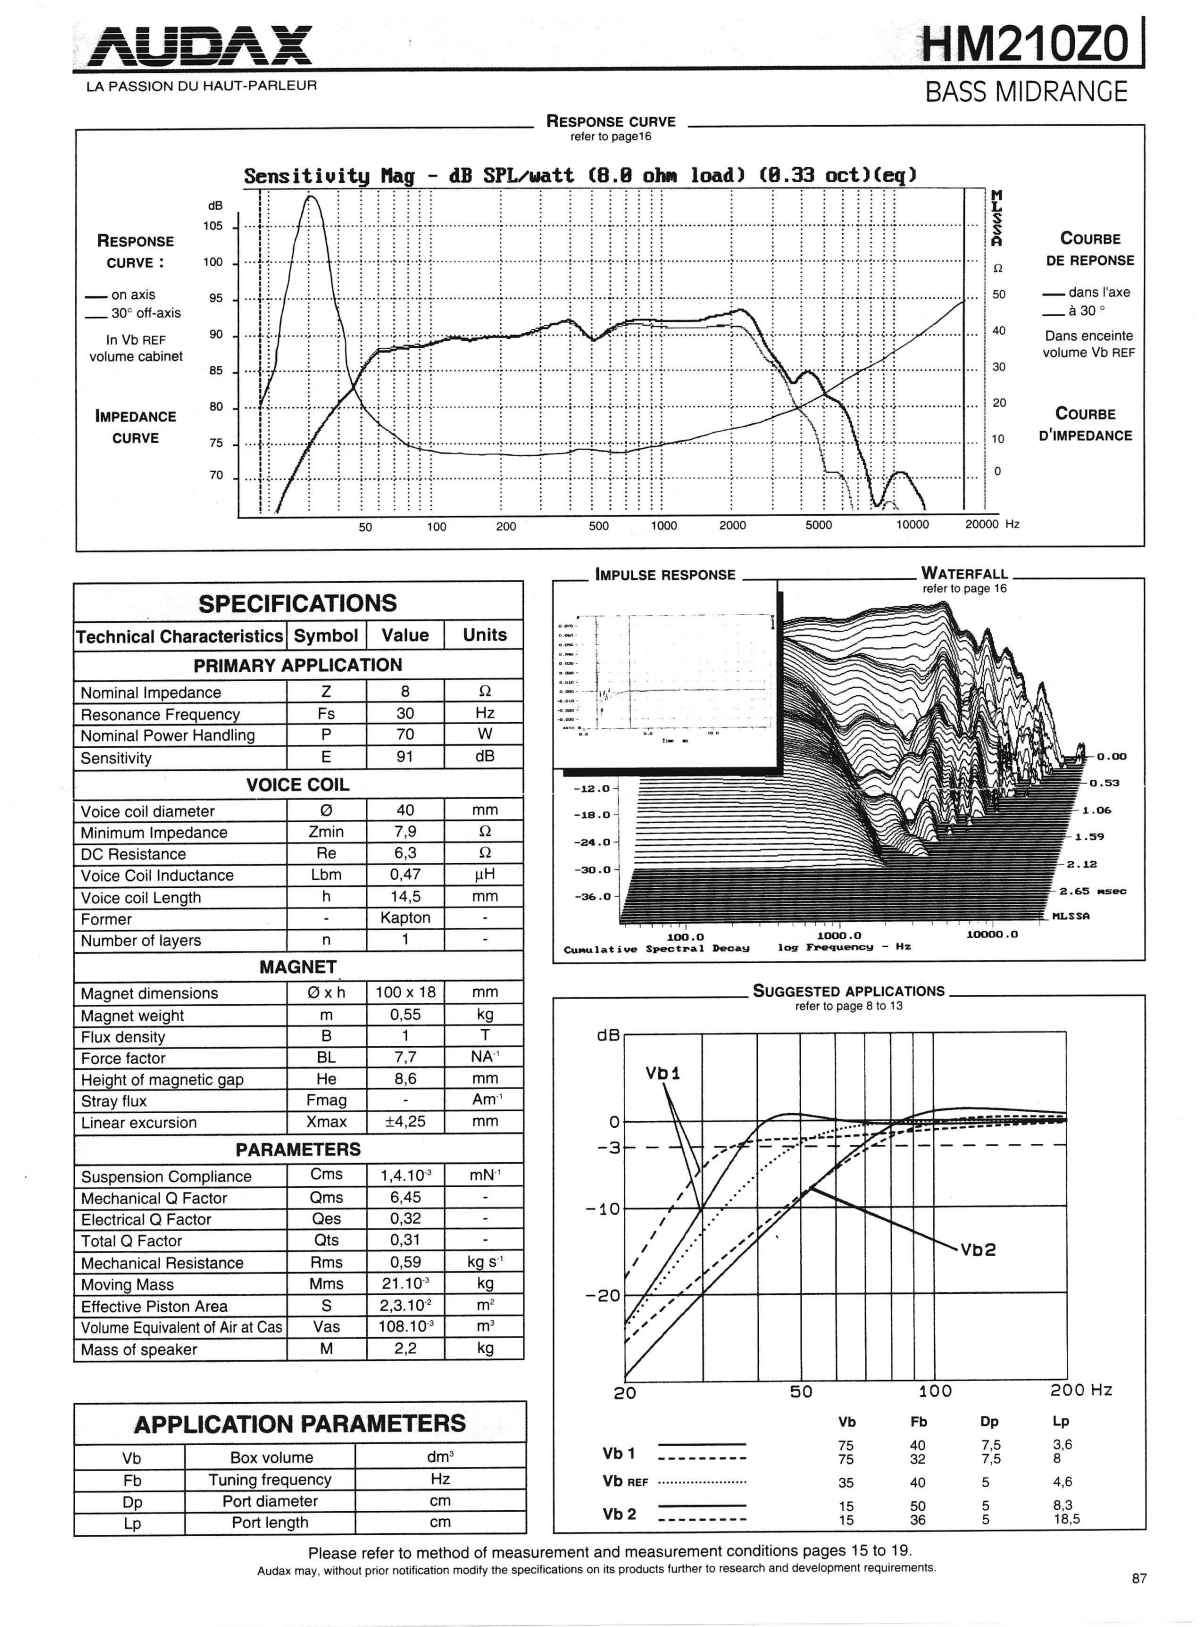
Woofer: Audax HM210Z0 8" Aerogel Midbass - data sheet
Click here to see measurements of the drivers used
Because digital crossovers are normally outside the realm of DIY speaker building, I have decided to outline the steps that I have taken in my design process. Please note that this proceedure is far from well proven and can no doubt be improved as more experience is gained. Matlab mathematics software was used for most of the design process.
Step 1 - Model driver frequency response
This means editing the measured response to correct any measurement anomalies. It is useful to extend the roll-off of the drivers response with a linear slope that extends well below the measurement noise floor. Smoothing can also be applied at this stage.
Step 2 - Calculate driver phase response
This was performed with CALSOD software package using the Hilbert-Bode Transform. This uses the Frequency response model to obtain the 'zero-delay' phase. The Hilbert transform assumes that the driver is a purely minimum phase device which is a perfectly good assumption for most aspects of crossover design. However, to accurately account for any low level delayed resonances, a MLS measurement of the impulse response can be used to obtain the phase data. Unfortunately MLS measurements were not available for this project.
Step 3 - Choose Phase response targets
One of my design objectives was to achieve efficient use of the available processing power. With FIR filters, this means minimising the number of filter taps. From a understanding of the fourier transfrom, we can say that the filter length required is inversely proportional to the freqeuncy of the signal that needs to be processed. With this in mind, it is clear that to reduce the filter length we need to avoid processing low-frequency signals. To achieve this I decided to choose the low frequency phase response target to match that of the driver itself. If a good match is made, the transfer function of the required filter will be linear-phase in the low-frequency range, so the largest filter coefficients are lumped near the centre of the filter's length.
This is particularly important for frequecy extremes at each end of the audio spectrum. Even though it is not desired to place any crossover on the bottem end of the bass driver, it is still important to use a target transfer function that inlcudes the low frequency phase shift contained in the measured data.
The nature of discrete-time signal processing makes it difficult to accurately equalise the phase response in the top-ocatve of the audio spectrum. For this reason I have chosen the target phase response to match the high freqency phase response of the tweeter, as shown in the diagram below. The high frequency phase equalisation of the midrange driver has the same limitations, but the midrange phase in this region is unimportant as the midrange driver is operating at -60dB at these frequencies.
Step 4- Choose crossover points and slopes
In a similar vein to the previous step, the natural low-frequency roll-off of the midrange driver can be used as part of the crossover in order to minimise the filter's length. This type of design means that the midrange driver is operating close to its fundamental resonant frequency. Since a drivers excursion quadruples for every ocatve lower in frequency, steep crossover slopes must be used to keep the excursion requirements at a safe level. In this design the target response chosen has a total acoustic slope of 36dB/octave. As the midrange driver naturally has a 12dB/octave roll-off, the digital filter required to meet this target will be nominally 24dB/octave.
The midrange drivers phase response was found to be very similar to that of a 2nd order Linkwitz-Riley high-pass filter with a turnover frequency of 1.1kHz. This was chosen as the crossover frequency for the mid/bass crossover as it enables the drivers natural roll-off to be most effectively incorporated into the final crossover.
Step 5 - Generate Target Transfer Funcitons
With digital crossovers the designer has a great deal more freedom in choice of the Target transfer function than if using analogue electronics. In particular there is no fixed relationship between the amplitude and phase response. Here it is convenient to use a target Transfer function made up from a combination of minimum-phase and linear-phase filter sections.
As this is inteded to be a phase tracking design, the phase of the all three drivers must track each other through the crossover regions at 1.1khz and 5khz. The phase target chosen is that of a second order Linkwitz-Riley crossover, while the amplitude response target is that of a 6th order Linkwitz-Riley crossover.
The 6th order Linkwitz-Riley amplitude target is actually the product of two 3rd order Butterworth filter sections, or 'Butterworth-Squared' as it is also known. To remove the large phaseshifts of 540 degrees per crossover point, I take the absolute value of the complex tranfer function and then multiply by the phase target of the 2nd order LR crossover. The resulting transfer function has 180 degrees phase shift per crossover point. The midrange driver must be connected in reverse polarity to achieve in-phase acoustic summation between all 3 drivers.
The target transfer functions are shown in the figure below. Note that the tweeter's phase target is identical to that of the midrange. The phase target of the bass driver is different so that it matches the phase shift of the sealed enclosure used for the measured data.
Step 6 - Calculate Equalisation Transfer Funciton
Now that the transfer functions of the Target frequency response for each driver have been calculated, they must be divided by the transfer function of each driver to get the required equalisation functions. Because the measurement of the driver's response is numerical data, this division must be evaluated for each point of measured data using the complex number representation of the transfer function at that frequency.
EQ(s) = Target(s) / Driver(s)
Step 7 - Edit Equaliation curves
As discussed in Step 3, it is intended that the filter's transfer function be linear-phase at low frequencies. If Step 3 was executed correctly, the required phase equalisation should be close to zero at least up to the crossover frequency. In reality there will be small bumps in the drivers response causing the required phase EQ to deviate from Zero. Since a phase tracking crossover is not sensitive to small phase errors, there is no harm in manually editing the phase response to get a smooth linear-phase Equalisation curve at low frequencies. Similarly, it is desirable to have an a equalisation curve with a flat frequency response at low frequencies extending right down to DC. So in the intrests of reducing the Filter length, I edited the amplitude and phase equalisation curves using MS Excel spreadsheet program.
Step 8 - Find FIR filter co-effiecients
This is done by simply taking the inverse Fourier transform of the equalisation curve. Before performing the transform, the Equalistion curve was mirrored to generate values for negative frequency that are required for the Transform. A FFT size of 1024 points are used. This relates to 513 points of the calculated equalistion curve, the remaining 511 point relate to the same data mirrored into the negative frequency range.
Step 9 - Apply windowing functions and check simulated response
The filter co-efficients generated by the previous step will have as many points as the FFT size used to generate them. For current DSP processors that achieve typically up to 100MAC/s @ 100MHz, 1024 tap filters could not be implemented. To use a 1024 Tap FIR filter at a sampling rate or 44.1kHz for a 3-Way stero pair, a processor rate of over 270MAC/s is needed. These calculations do not include any overheads, and is simply based on the number of calcuations required.
To reduce the number of taps to a more reasonable number, the calculated array of filter co-efficients can be truncated. Because simple truncation generates response anomalies, windowing functions should be used to shape the truncated array.
View results of Bass Driver Filter Design
View results of Midrange Driver Filter Design
View results of Tweeter Filter Design
[To be completed later]