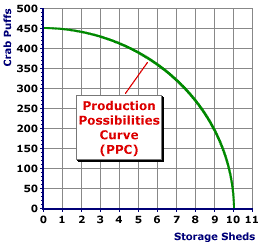
Graphs are often used in Economics to analyze the choices and trade-offs that poeple make. Production possibilities curve shows alternative ways to use an economy's productive resources. To draw a production possibilities curve, an economist begins by deciding which goods or services to examine. The line that we can draw is called the production possibilities fronteir. That line represents a point at which Capeland is using all of it's resources to produce a maximum combination of those two products.
|
What is Economics?|Scarcity and the Factors of Production|Opportunity Cost|Production Possibilities Curves|Interpreting Line Graphs
|

