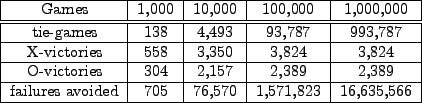
Our system was tested four times, each time starting with a null or empty failure database. In order, the system played 1,000 games, 10,000 games, 100,000 games, and 1,000,000 games of tic-tac-toe. Figure 1 shows, in table format, some of the recorded statistics for each of the four tests. Figure 2 shows the number of tie-games, X-victories, and O-victories as a function of the number of games played. Figure 2 is plotted on a logarithmic versus logarithmic scale, so all the data is visible.
Figure 2: Performance (logarithmic vs. logarithmic)
It is obvious that our system learns how to play tic-tac-toe, or at least, it learns how not to lose. Notice that the statistics for X-victories and O-victories are the same when the system played either 100,000 games or 1,000,000 games, except for the number of failures avoided, since a different number of games were played in each case. When either 100,000 or 1,000,000 games were played, the usual result was a tie-game, and a huge number of failures were avoided in both cases. I cannot claim that there are only 3,824 unique X-victories in the game of tic-tac-toe, and I also cannot claim that there are only 2,389 unique O-victories in the game of tic-tac-toe, since our system chooses moves randomly, using a random number generator which I will not describe. Since the choice of moves is random, we cannot support either claim.
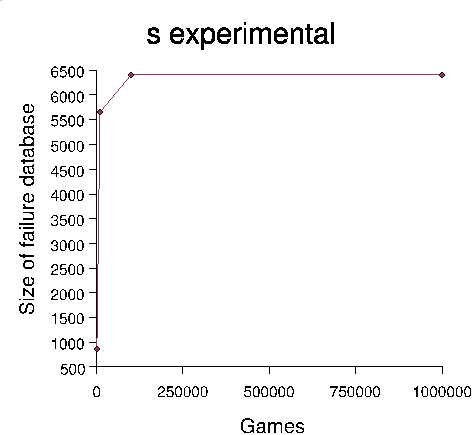
Figure 3 shows, in table format, the size of the failure database at the end of each experiment. Figure 4 plots the data from Figure 3. The failure database grows quickly and stabilizes.
After playing 1,000,000 games, the failure database contains 6,409 unique failures. Again, even though the size of the failure database is the same when either 100,000 games or 1,000,000 games were played, I cannot claim that the failure database of size 6,409 includes all possible and unique failures in the game of tic-tac-toe. Again, since moves are chosen randomly using a random number generator which I will not describe, the claim cannot be supported.
Remember, ![]() is our best estimate of the size of the failure database
after our best experiment, so
is our best estimate of the size of the failure database
after our best experiment, so
![]() . From
. From ![]() we can
compute the ratio
we can
compute the ratio ![]() , assuming the ratio
, assuming the ratio ![]() exists. Using the
formula from the theory section, and using
exists. Using the
formula from the theory section, and using
![]() , we find that
, we find that
![]() or
or
![]() . In other words, if the ratio
. In other words, if the ratio ![]() exists, then whether it is X's turn to play, or O's turn to play,
exists, then whether it is X's turn to play, or O's turn to play,
![]() of the legal moves available to 'X' or to 'O' on any given turn
of any given game of tic-tac-toe, will result in a failure or loss of the
game.
of the legal moves available to 'X' or to 'O' on any given turn
of any given game of tic-tac-toe, will result in a failure or loss of the
game.