I analysed data from 1989/90 onwards, but an excellent paper by Abelson and colleagues (2005) looked at house prices throughout Australia from 1970. They noted 4 house price booms over that period: a) from 1972-74, and they stated �the combination of high inflation, full negative gearing and no capital gains tax produced high returns to investors�; b) 1979-81, and they stated �policy setting continued to be favourable for investors�; c) 1987-89, and they stated �the collapse of the stock market in September 1987 sparked a flow of funds into housing�; and d) 1997-2003, and they stated �Investor demand for housing was high. The boom appeared to get a second wind � from favourable policy settings for investors, including negative gearing combined with high marginal tax rates and a perceived lowering of the CGT.�
For Brisbane, they found that, real house prices (i.e. adjusted for inflation) fell between 1974 and 1980, and1982 and 1987.
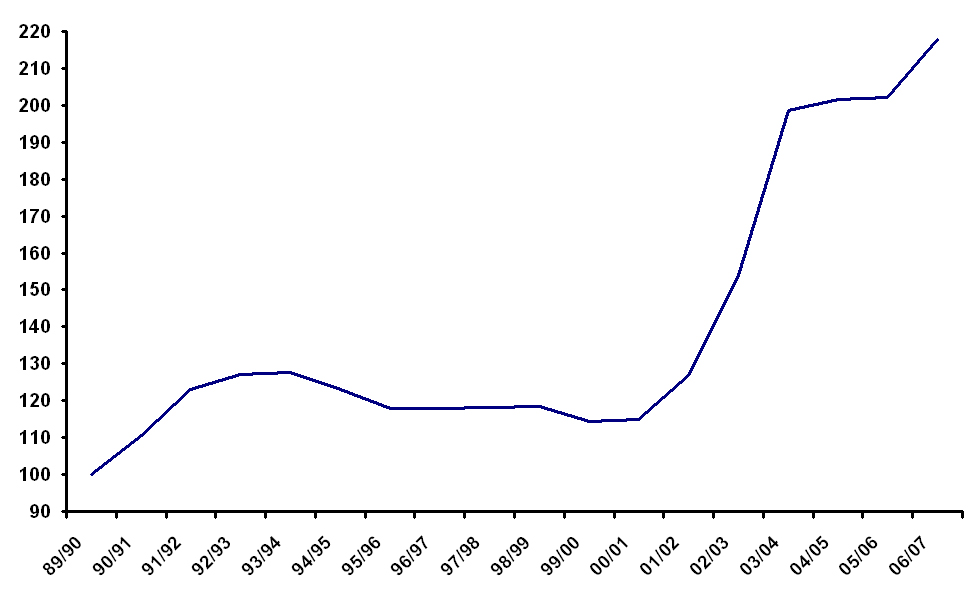
My analysis of ABS data, adjusted for inflation using the calculator on the RBA website, shows that Brisbane house prices failed to keep up with inflation for over 9 years from 1991/92 to 2000/01 (Figure 1).
|