
Graphing Systems of Equations
( Linear Inequalities )
To graph a system of linear
inequalities , do the following for each inequality in
the system:
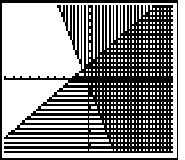
The graph of the system is the region common to all of the half- planes . If you used colored pencils, it is the region that has been shaded with every color. |
||
Solution |
||
| Graph the system. | Y>-3x
- 1 y< x + 2 |
Inequality
1 Inequality 2 |
| Begin by graphing each linear inequality use a different color for each half plane . For instance , you can use vertical lines for Inequality 1 and horizontal linesfor Inequality 2 . The graph of the system is the region that is darkley shaded. |
Shade the half plane on and to the right of y= -3x - 1 Shade the half plane below y= x + 2 |
|
 The graph of the system is th
intersection of the two lines.
The graph of the system is th
intersection of the two lines.