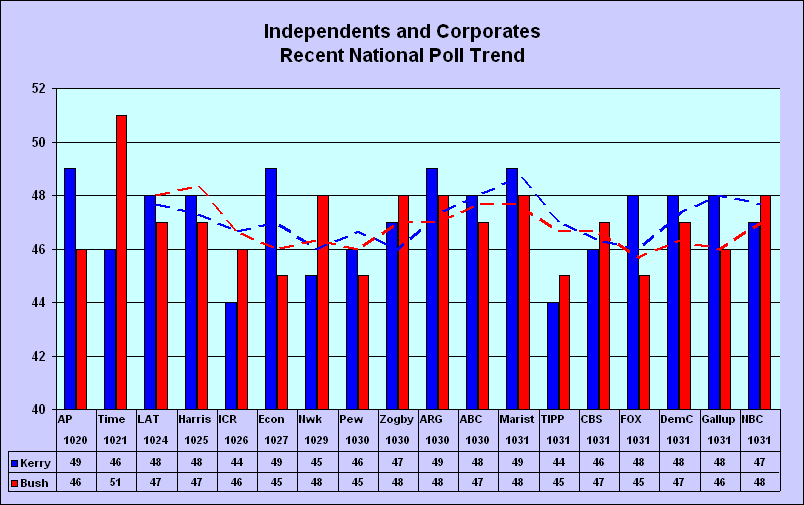
The final pre-election
state polls matched the pre-election
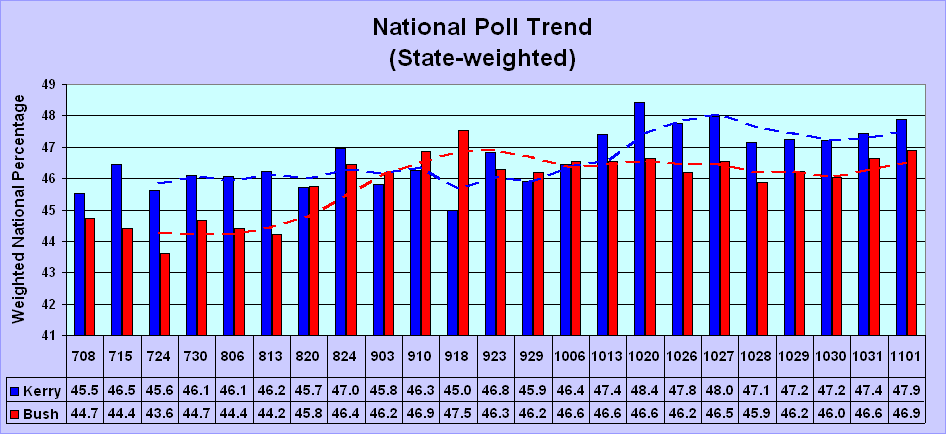
national polls.
Kerry led the final pre-election state poll weighted average by 47.7- 47.0%.
He also led the 18
final national polls by 47.3 - 46.9%.
The final weighted average state model
projection exactly matched the final 5-poll national average.
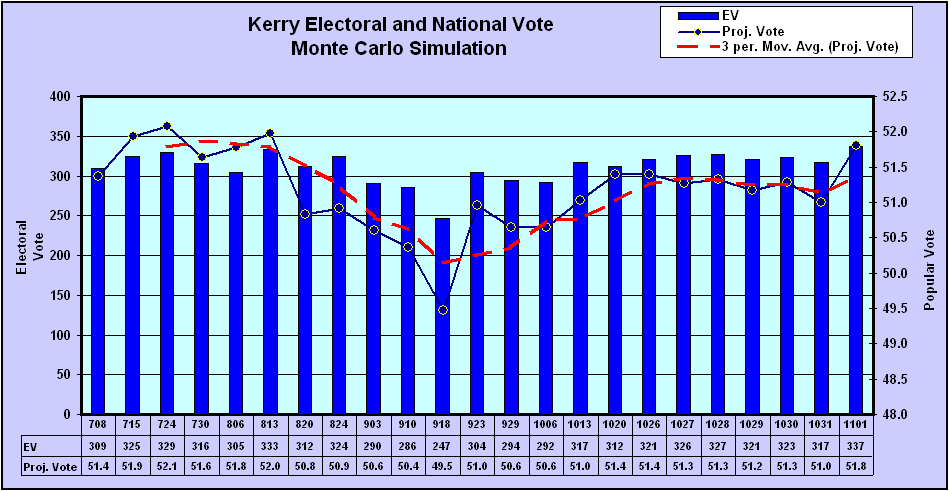
The Final
2004 Election Model projected
that Kerry would win 337-201 EV with 51.8%.
The final 18 national poll average
projection was 51.6%.
Kerry’s
projected vote share was within 2.0% of his exit poll share in 23 states.
Bush won
the recorded vote by 62 - 59m (50.7- 48.4%) and the electoral vote by 286 -
251.
Approximately
3.4 million votes were uncounted.
The
Respondents were randomly selected and the margin of error was 1.1%.
The Final
National Exit poll was forced to match the fraudulent recorded vote.
The exit pollsters released the Edison-Mitofsky
2004 Exit Poll Evaluation in Jan. 2005.
E-M discussed polling methodology and provided summary
statistics by state, region and voting method.
The
All FINAL National Exit Polls are 'forced' to match the Recorded Vote.
The 'forcing' of the 2004 Exit Poll numbers resulted in IMPOSSIBLE
demographics.
Within Precinct Error (WPE) is the average deviation between
unadjusted exit poll and recorded vote.
It is more
appropriate to call the difference a Within Precinct Discrepancy (WPD).
Kerry won
the unadjusted
(WPD) aggregate state exit poll
by 52.0-47.0% (average of three measures).
The WPD
exceeded 6% in 25 states for Bush. It exceeded 4% in 34 states for Bush and
just 2 for Kerry.
The WPD
was less than 2% in 8 heavily Republican states (AR, ID, IN, KS, KY, MT, OK and
TN) and
Democratic
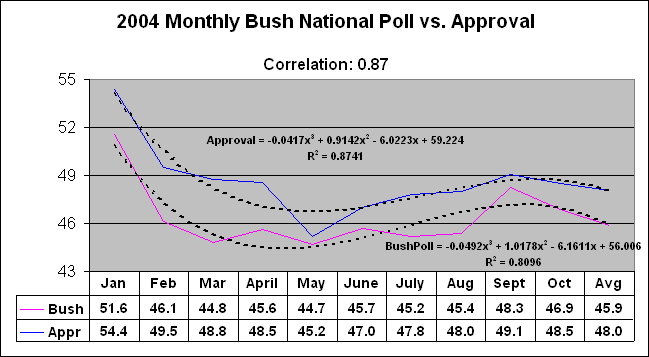
Professional pollsters allocate undecided voters
in every election.
The majority are allocated to the challenger, especially if the incumbent is
unpopular.
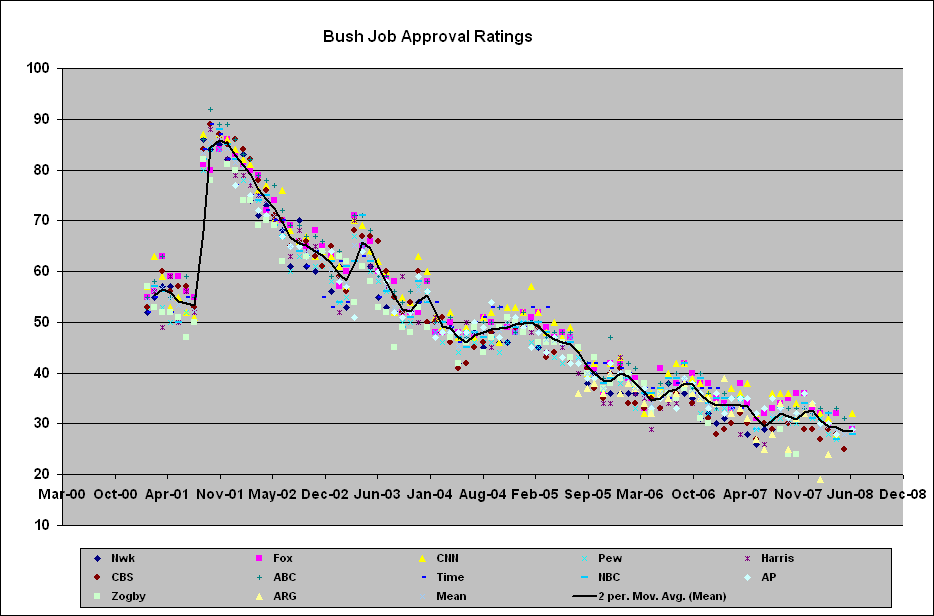
Bush had a 48% approval
rating on Election Day.
There was a strong 0.87 correlation between Bush monthly approval
and his poll numbers.
The Gallup
Poll allocated 90% of undecided voters to Kerry.
Harris and Zogby projected that he would get 67-80% of undecided
voters.
The Final
Election Model base case scenario assumed Kerry would capture 75% of undecided
voters.
Pre-election and Exit Poll Confirmation
Final pre-election polls showed Kerry and Bush in a virtual
tie.
The unweighted state average favored Bush, but Kerry led the aggregate weighted
average.
The pre-election aggregate state polls closely matched the national
poll average.
A few still
claim that polling
analysis cannot prove that the 2004 election was stolen.
They claim
the Final
National Exit Poll (NEP) was correct
and the unadjusted exit polls were wrong.
But a careful analysis of the
pre-election and exit polls provides powerful evidence that it was.
The Final was forced
to match
the recorded vote using impossible weightings.
After undecided voters
were allocated, the pre-election polls matched the unadjusted exit polls.
Simple MATH proves
that the Final NEP inflated the number of returning Bush voters by 6.6m.
The Final indicates that Bush 2000 voters comprised 43% (52.6m) of the 2004 electorate (122.3m).
But Bush only had 50.5m
recorded votes in 2000.
Voter mortality tables show that approximately 2m Bush 2000
voters died prior to 2004.
And about 2.5m Bush 2000 voters did not vote in 2004,
assuming that 95% of 48.5m voted.
Therefore, only about
46.0m Bush 2000 voters could possibly have returned to vote in 2004.
But according to the
Final NEP, 52.6m returned to vote – a
mathematical impossibility.
Bush needed 16 million new voters to achieve his 62m
recorded vote.
According to the 2004
Election Calculator, he had 57m of 125.7m, an 11m increase.
Where
did Bush find 16m new voters?
Kerry won the final 5m
recorded votes by 54.3 - 45.7%.
These were late votes recorded a few days after the
election.
They consisted primarily of absentee and provisional
ballots.
Bush won the 2004 recorded vote by 62.0 - 59.0m (50.7-
48.3%) and had 286 EV.
Of 3.4 million uncounted votes, approximately 2.6m were for
Kerry - a net 1.8m margin.
Bush’s 3.0m margin is thus reduced to 1.2m – and that’s
before vote-switching.
To
believe that Bush won, one must believe that the pre-election and
unadjusted exit polls were wrong.
And also believe that the Final Exit Poll, although mathematically impossible,
was accurate.
The
The NEP
margin of error was 1.12%, assuming a 30% exit poll cluster effect.
Kerry’s final projected vote share was
- greater
than his recorded vote share in 47 states
- lower
than his unadjusted exit poll share in 45 states
- within 2.0%
of the unadjusted exit poll in 21 states and within 1% in 12 states
- at least
2% higher than his recorded vote share in 33 states
The WPE exceeded 6.0 in 25 states.
The probability of this occurrence
is effectively ZERO.
The Election Model utilized 18 final national polls, 9 RV and 9
After allocating 75% of undecided voters to Kerry, he led by 50.9 - 48.1%
Based on the 122.3m recorded vote, he won by 62.3 - 58.8m.
But this does not include 3.4m uncounted votes (2.74% of total votes
cast).
Assuming that Kerry won 75% of the uncounted votes, add 2.5m to his total
and 0.8m to Bush.
Kerry's margin becomes 64.8- 59.6m (51.6 - 47.4%).
That's
within 0.2% of his 51.8% unadjusted aggregate state exit poll share.
This model indicates that Kerry won the 2004 True
Vote in a 67-57m landslide (53.2 - 45.4%).
2000 voter turnout in 2004 was total votes cast in 2000 less mortality
times the turnout percentage.
In 2000, the Census reported that 110.8m votes
were cast, but only 105.4m were
recorded.
In 2004, the Census reported
that 125.7m votes cast, but only 122.3m were recorded.
The Calculator determines the True
Vote based on the estimated shares of returning voters.
The
Kerry won 57% of new voters and others who did not vote in
2000.
He won 91% of returning Gore voters and 10% of Bush voters.
He captured 64% of returning Nader
voters. Bush had 17%.
Exit poll
critics claim the unadjusted and
adjusted (GEO, Composite) exit polls were wrong.
They argue
that the final exit polls, which were
forced to match the recorded vote, were correct.
The Final National Exit Poll overstated
the number of returning Bush voters by 6.6m.
This analysis is proof that it is
mathematically impossible:
The Final indicates
that 43% (52.6m) of the 2004 electorate (122.3m) were Bush 2000 voters.
But Bush
only had 50.5m recorded votes in 2000. Approximately 2.5m of them died prior to
2004.
So 48m Bush
2000 voters were still alive in 2004. If 96% voted, then 2m did not return to vote.
Therefore, only 46.0m (37.6% of
122.3m) Bush 2000 voters could have voted in 2004.
This calculation is a close
approximation to the number of new 2004 voters:
In 2000, 110.8m votes cast but only 105.4m were recorded (5.4m were
uncounted).
Assuming that he had 4m uncounted votes (75% of the total), Gore had nearly 55.0m votes,
Approximately 5m voters in 2000 died prior to 2004 and another 5m did not
vote, assuming a 95% turnout.
In 2004, 125.7m total votes were cast but only 122.3m recorded (3.4m were
uncounted).
Therefore, there were approximately 25m new voters in 2004.
According to the 12:22am National Exit Poll, Kerry won:
a) 14.3m (57%) new voters; Bush won 10.3m (41%),
b) 2.4m (64%) returning Nader and other voters; Bush had 0.6m (17%),
c) 5.1m (10%) returning Bush
voters; Bush won 4.1m (8%) of returning Gore voters.
Kerry won
the True Vote by 67-57m (53.2 - 45.4%). The calculation is:
TV = 66.7m
= 55m (Gore) - 6m (died + DNV) + 14.3m (new) + 2.4m (Other) + 5.1m (Bush) -
4.1m (Gore)
|
Summary of 2004 pre-election polls, exit polls and
the True Vote |
|||||
|
|
|
Kerry |
Bush |
|
|
|
Final
Recorded |
48.3 |
50.7 |
|
|
|
|
|
|
|
|
|
|
|
Pre-election
Polls |
|
|
|
|
|
|
State
aggregate |
|
|
|
|
|
|
Unweighted
average |
45.6 |
48.3 |
|
|
|
|
Weighted average |
47.7 |
47.0 |
|
|
|
|
|
|
|
|
|
|
|
National
Poll Averages |
|
|
|
|
|
|
Final
5 |
47.2 |
46.4 |
|
|
|
|
Final
18 |
47.3 |
46.9 |
|
|
|
|
131
|
|
45.6 |
48.1 |
(7/6-11/01) |
|
|
31 RV |
|
45.0 |
45.0 |
(7/6-9/26) |
|
|
Final
15 |
47.0 |
49.0 |
|
|
|
|
|
|
|
|
|
|
|
Election
Model (2-party
projection) |
|
|
|||
|
State |
|
51.8 |
48.2 |
|
|
|
Nat.
Final 5 |
51.8 |
48.2 |
|
|
|
|
Nat.
18 (9RV+9LV) |
51.6 |
48.4 |
|
|
|
|
|
|
|
|
|
|
|
Exit
Polls (Edison-Mitofsky) |
|
|
|
||
|
|
|
|
|
|
|
|
(WPE
measure) |
|
|
|||
|
VNS |
|
51.84 |
47.16 |
Prior
to 2002 = 4 outlier precincts removed |
|
|
IMS |
|
51.98 |
47.01 |
Input
Management Screen- all precincts included |
|
|
DSS |
|
52.15 |
46.85 |
Decision
Summary -4 outlier precincts removed |
|
|
|
|
|
|
|
|
|
Adjusted
State |
|
|
|
|
|
|
Best
GEO |
51.0 |
48.5 |
|
|
|
|
Composite
( |
50.3 |
49.1 |
|
|
|
|
|
|
|
|
|
|
|
|
|
|
|
|
|
|
National
Exit Poll |
|
|
|
|
|
|
Voted 2000 |
|
|
|
|
|
|
|
|
51.0 |
47.0 |
(8649
respondents, 38/41 Gore Bush weights) |
|
|
730pm |
|
50.9 |
47.1 |
(11027,
39/42) |
|
|
|
|
51.4 |
47.6 |
(13047,
39/41) |
|
|
|
50.8 |
48.2 |
|
|
|
|
|
|
|
|
|
|
|
Final
Exit Poll |
48.5 |
51.1 |
(13660,
37/43- matched to recorded vote count) |
||
|
|
|
|
|
|
|
|
True
Vote |
|
|
|
|
|
|
Election
Calculator |
53.2 |
45.4 |
39.5/37.1
weights (adj.
for voter mortality, turnout, uncounted votes) |
||
|
|
|
|
|
|
|
|
|
|
|
|
|
|
|
|
|
|
|
|
|
The 2004 Election Model: Final Projection Summary |
|
|
|
|
|
|
|
|
|
|||||||
|
|
|
|
|
|
|
|
|
|
|
|
|
|
|
|
|
|
|
|
|
|
|
|
|
|
|
|
|
|
|
|
|
|
|
|
|
|
|
|
|
Projection |
Elec. Vote |
2-party % |
Win Prob |
|
|
|
|
|
|
|
|
|
|
|
|
|
|
|
Kerry |
337 |
51.8 |
99.9 |
|
|
|
|
|
|
|
|
|
|
|
|
|
|
|
Bush |
201 |
48.2 |
0.1 |
|
|
|
|
|
|
|
|
|
|
|
|
|
|
|
|
|
|
|
|
|
|
|
|
|
|
|
|
|
|
|
|
|
|
|
|
|
|
|
|
|
|
|
|
|
|
|
|
|
|
|
|
|
|
|
|
|
|
|
|
|
|
|
|
|
|
|
|
|
|
|
|
|
State
EV Model |
|
|
|
|
|
|
|
|
|
|
|
|
|
|
|
|
Undecided% |
Allocation |
|
BaseCase |
|
|
|
|
|
|
|
|
|
|
|
|
|
|
|
Kerry |
60% |
67% |
75% |
80% |
87% |
|
|
|
|
|
|
|
|
|
|
|
|
|
Trial Wins |
4901 |
4972 |
4995 |
4997 |
4999 |
|
|
|
|
|
|
|
|
|
|
|
|
|
|
|
|
|
|
|
|
|
|
|
|
|
|
|
|
|
|
|
|
Projected% |
|
|
|
|
|
|
|
|
|
|
|
|
|
|
|
|
|
|
Kerry |
51.02 |
51.38 |
51.8 |
52.07 |
52.43 |
|
|
|
|
|
|
|
|
|
|
|
|
|
Bush |
48.98 |
48.62 |
48.2 |
47.93 |
47.57 |
|
|
|
|
|
|
|
|
|
|
|
|
|
|
|
|
|
|
|
|
|
|
|
|
|
|
|
|
|
|
|
|
Win Prob% |
|
|
|
|
|
|
|
|
|
|
|
|
|
|
|
|
|
|
Kerry |
98.02 |
99.44 |
99.9 |
99.94 |
99.98 |
|
|
|
|
|
|
|
|
|
|
|
|
|
Bush |
1.98 |
0.56 |
0.1 |
0.06 |
0.02 |
|
|
|
|
|
|
|
|
|
|
|
|
|
|
|
|
|
|
|
|
|
|
|
|
|
|
|
|
|
|
|
|
Electoral
Vote |
|
|
|
|
|
|
|
|
|
|
|
|
|
|
|
|
|
|
Average
|
320 |
328 |
337 |
343 |
352 |
|
|
|
|
|
|
|
|
|
|
|
|
|
Median |
322 |
329 |
338 |
345 |
353 |
|
|
|
|
|
|
|
|
|
|
|
|
|
Maximum |
379 |
388 |
399 |
405 |
412 |
|
|
|
|
|
|
|
|
|
|
|
|
|
Minimum |
211 |
237 |
223 |
243 |
254 |
|
|
|
|
|
|
|
|
|
|
|
|
|
|
|
|
|
|
|
|
|
|
|
|
|
|
|
|
|
|
|
|
95%
Conf. Interval |
|
|
|
|
|
|
|
|
|
|
|
|
|
|
|
|
|
|
Upper
Limit |
361 |
368 |
376 |
382 |
389 |
|
|
|
|
|
|
|
|
|
|
|
|
|
Lower
Limit |
278 |
288 |
298 |
305 |
315 |
|
|
|
|
|
|
|
|
|
|
|
|
|
|
|
|
|
|
|
|
|
|
|
|
|
|
|
|
|
|
|
|
National
18-Polls |
|
|
|
|
|
|
|
|
|
|
|
|
|
|
|
|
|
|
Vote% |
50.73 |
51.15 |
51.63 |
51.92 |
52.34 |
|
|
|
|
|
|
|
|
|
|
|
|
|
Prob% |
97.55 |
99.9 |
100 |
100 |
100 |
|
|
|
|
|
|
|
|
|
|
|
|
|
|
|
|
|
|
|
|
|
|
|
|
|
|
|
|
|
|
|
|
States
Won |
26 |
27 |
27 |
28 |
30 |
|
|
|
|
|
|
|
|
|
|
|
|
|
|
|
|
|
|
|
|
|
|
|
|
|
|
|
|
|
|
|
|
|
|
|
|
|
|
|
|
|
|
|
|
|
|
|
|
|
|
|
|
|
|
|
|
|
|
|
|
|
|
|
|
|
|
|
|
|
|
2004 Election Model: |
|
|
|
|
|
|
|
|
||||||||
|
|
|
|
|
|
|
|
|
|
|
|
|
|
|
|
|
|
|
|
|
State
Model |
|
|
|
|
|
|
|
|
|
|
|
|
|
|
|
|
|
|
|
|
Final |
Vote |
Final |
Poll |
Projected |
Exit Poll |
EP-Vote |
EP-Proj |
Exit Poll |
Kerry |
Kerry |
Proj-EP < |
Proj-vote > |
WPE> |
|
|
|
State |
EV |
Kerry |
Bush |
Kerry |
Bush |
Kerry |
Kerry |
Diff |
Diff |
WPE |
Proj EV |
EP EV |
2.0 |
2.0 |
6.0 |
|
|
|
Average |
538 |
48.3 |
50.7 |
47.7 |
47.0 |
51.0 |
51.8 |
3.6 |
0.8 |
7.1 |
331 |
325 |
21 |
33 |
25 |
|
|
|
|
|
|
|
|
|
|
|
|
|
|
|
|
|
|
|
|
|
|
|
9 |
36.8 |
62.5 |
39 |
57 |
41.3 |
42.5 |
5.7 |
1.2 |
11.3 |
|
|
yes |
yes |
yes |
|
|
|
AK |
3 |
35.5 |
61.1 |
30 |
57 |
39.0 |
40.3 |
4.8 |
1.3 |
9.6 |
|
|
yes |
yes |
yes |
AK |
|
|
AZ |
10 |
44.4 |
54.9 |
45 |
50 |
48.0 |
46.7 |
2.3 |
(1.3) |
4.6 |
|
|
yes |
yes |
|
AZ |
|
|
AR |
6 |
44.5 |
54.3 |
46 |
48 |
49.8 |
44.8 |
0.3 |
(5.0) |
0.5 |
6 |
|
|
yes |
|
AR |
|
|
CA |
55 |
54.3 |
44.4 |
49 |
42 |
55.0 |
59.8 |
5.5 |
4.8 |
10.9 |
55 |
55 |
|
|
yes |
CA |
|
|
|
|
|
|
|
|
|
|
|
|
|
|
|
|
|
|
|
|
|
CO |
9 |
47.0 |
51.7 |
47 |
48 |
50.0 |
50.1 |
3.1 |
0.1 |
6.1 |
9 |
9 |
yes |
yes |
yes |
CO |
|
|
CT |
7 |
54.3 |
43.9 |
52 |
42 |
55.8 |
62.2 |
7.9 |
6.4 |
15.7 |
7 |
7 |
|
|
yes |
CT |
|
|
DC |
3 |
89.2 |
9.3 |
78 |
11 |
85.5 |
90.9 |
1.7 |
5.4 |
3.4 |
3 |
3 |
|
|
|
DC |
|
|
DE |
3 |
53.3 |
45.8 |
45 |
38 |
57.0 |
61.3 |
8.0 |
4.3 |
15.9 |
3 |
3 |
|
yes |
yes |
DE |
|
|
FL |
27 |
47.1 |
52.1 |
50 |
47 |
51.5 |
50.9 |
3.8 |
(0.6) |
7.6 |
27 |
27 |
yes |
yes |
yes |
FL |
|
|
|
|
|
|
|
|
|
|
|
|
|
|
|
|
|
|
|
|
|
GA |
15 |
41.4 |
58.0 |
42 |
52 |
45.8 |
42.5 |
1.1 |
(3.3) |
2.2 |
|
|
|
yes |
|
GA |
|
|
HI |
4 |
54.0 |
45.3 |
45 |
45 |
51.8 |
56.4 |
2.4 |
4.6 |
4.7 |
4 |
4 |
|
|
|
HI |
|
|
ID |
4 |
30.3 |
68.4 |
30 |
59 |
37.5 |
30.8 |
0.5 |
(6.7) |
1.0 |
|
|
|
yes |
|
ID |
|
|
IL |
21 |
54.8 |
44.5 |
54 |
42 |
56.3 |
57.0 |
2.2 |
0.8 |
4.4 |
21 |
21 |
yes |
|
|
IL |
|
|
IN |
11 |
39.3 |
59.9 |
39 |
58 |
40.5 |
40.0 |
0.8 |
(0.5) |
1.5 |
|
|
yes |
|
|
IN |
|
|
|
|
|
|
|
|
|
|
|
|
|
|
|
|
|
|
|
|
|
IA |
7 |
49.2 |
49.9 |
50 |
44 |
53.8 |
50.7 |
1.5 |
(3.0) |
3.0 |
7 |
7 |
|
yes |
|
IA |
|
|
KS |
6 |
36.6 |
62.0 |
37 |
60 |
38.5 |
37.5 |
0.9 |
(1.0) |
1.7 |
|
|
yes |
|
|
KS |
|
|
KY |
8 |
39.7 |
59.6 |
39 |
56 |
42.0 |
39.6 |
(0.0) |
(2.4) |
(0.1) |
|
|
|
yes |
|
KY |
|
|
LA |
9 |
42.2 |
56.7 |
40 |
48 |
48.3 |
44.1 |
1.9 |
(4.1) |
3.8 |
|
|
|
yes |
|
LA |
|
|
ME |
4 |
53.6 |
44.6 |
50 |
39 |
57.5 |
55.5 |
1.9 |
(2.0) |
3.8 |
4 |
4 |
|
yes |
|
ME |
|
|
|
|
|
|
|
|
|
|
|
|
|
|
|
|
|
|
|
|
|
MD |
10 |
55.9 |
42.9 |
54 |
43 |
55.5 |
60.0 |
4.1 |
4.5 |
8.1 |
10 |
10 |
|
|
yes |
MD |
|
|
MA |
12 |
61.9 |
36.8 |
64 |
27 |
70.0 |
64.8 |
2.9 |
(5.2) |
5.8 |
12 |
12 |
|
yes |
|
MA |
|
|
MI |
17 |
51.2 |
47.8 |
52 |
45 |
53.5 |
54.4 |
3.2 |
0.9 |
6.3 |
17 |
17 |
yes |
yes |
yes |
MI |
|
|
MN |
10 |
51.1 |
47.6 |
52 |
44 |
54.3 |
55.7 |
4.7 |
1.5 |
9.3 |
10 |
10 |
yes |
yes |
yes |
MN |
|
|
MS |
6 |
40.2 |
59.0 |
42 |
51 |
46.5 |
45.8 |
5.7 |
(0.7) |
11.3 |
|
|
yes |
yes |
yes |
MS |
|
|
|
|
|
|
|
|
|
|
|
|
|
|
|
|
|
|
|
|
|
MO |
11 |
46.1 |
53.3 |
44 |
49 |
48.5 |
49.0 |
2.9 |
0.5 |
5.8 |
|
|
yes |
yes |
|
MO |
|
|
MT |
3 |
38.6 |
59.1 |
36 |
57 |
40.5 |
37.7 |
(0.9) |
(2.8) |
(1.8) |
|
|
|
|
|
MT |
|
|
NE |
5 |
32.7 |
65.9 |
32 |
61 |
36.5 |
36.7 |
4.1 |
0.2 |
8.1 |
|
|
yes |
yes |
yes |
NE |
|
|
NV |
5 |
47.9 |
50.5 |
49 |
49 |
49.8 |
52.9 |
5.1 |
3.2 |
10.1 |
5 |
5 |
|
|
yes |
NV |
|
|
NH |
4 |
50.2 |
48.9 |
47 |
47 |
50.8 |
57.0 |
6.8 |
6.3 |
13.6 |
4 |
4 |
|
|
yes |
NH |
|
|
|
|
|
|
|
|
|
|
|
|
|
|
|
|
|
|
|
|
|
NJ |
15 |
52.9 |
46.2 |
50 |
42 |
55.3 |
57.8 |
4.9 |
2.5 |
9.7 |
15 |
15 |
|
yes |
yes |
NJ |
|
|
NM |
5 |
49.0 |
49.8 |
49 |
49 |
49.8 |
52.9 |
3.9 |
3.2 |
7.8 |
5 |
5 |
|
|
yes |
NM |
|
|
NY |
31 |
58.4 |
40.1 |
57 |
39 |
59.3 |
64.1 |
5.7 |
4.8 |
11.4 |
31 |
31 |
|
|
yes |
NY |
|
|
NC |
15 |
43.6 |
56.0 |
47 |
50 |
48.5 |
49.2 |
5.7 |
0.7 |
11.3 |
|
|
yes |
yes |
yes |
NC |
|
|
ND |
3 |
35.5 |
62.9 |
35 |
55 |
41.8 |
32.9 |
(2.6) |
(8.9) |
(5.2) |
|
|
|
yes |
|
ND |
|
|
|
|
|
|
|
|
|
|
|
|
|
|
|
|
|
|
|
|
|
OH |
20 |
48.7 |
50.8 |
50 |
47 |
51.5 |
54.2 |
5.5 |
2.7 |
10.9 |
20 |
20 |
|
yes |
yes |
OH |
|
|
OK |
7 |
34.4 |
65.6 |
28 |
61 |
35.5 |
33.5 |
(1.0) |
(2.0) |
(1.9) |
|
|
|
|
|
OK |
|
|
OR |
7 |
51.3 |
47.2 |
50 |
44 |
53.8 |
53.0 |
1.7 |
(0.8) |
1.8 |
7 |
7 |
yes |
yes |
|
OR |
|
|
PA |
21 |
50.9 |
48.4 |
50 |
45 |
53.0 |
55.3 |
4.4 |
2.3 |
8.8 |
21 |
21 |
|
yes |
yes |
PA |
|
|
RI |
4 |
59.4 |
38.7 |
56 |
36 |
61.3 |
61.8 |
2.4 |
0.5 |
4.7 |
4 |
4 |
yes |
|
|
RI |
|
|
|
|
|
|
|
|
|
|
|
|
|
|
|
|
|
|
|
|
|
SC |
8 |
40.9 |
58.0 |
42 |
55 |
43.5 |
45.9 |
5.0 |
2.4 |
10.0 |
|
|
|
yes |
yes |
SC |
|
|
SD |
3 |
38.4 |
59.9 |
42 |
52 |
45.8 |
36.3 |
(2.1) |
(9.4) |
(4.2) |
|
|
|
yes |
|
SD |
|
|
TN |
11 |
42.5 |
56.8 |
47 |
50 |
48.5 |
42.8 |
0.3 |
(5.7) |
0.5 |
|
|
|
yes |
|
TN |
|
|
TX |
34 |
38.2 |
61.1 |
37 |
59 |
39.3 |
40.6 |
2.4 |
1.4 |
4.8 |
|
|
yes |
|
|
TX |
|
|
UT |
5 |
26.0 |
71.5 |
24 |
69 |
28.5 |
29.2 |
3.2 |
0.7 |
6.4 |
|
|
yes |
yes |
yes |
UT |
|
|
|
|
|
|
|
|
|
|
|
|
|
|
|
|
|
|
|
|
|
VT |
3 |
58.9 |
38.8 |
53 |
40 |
57.5 |
66.4 |
7.5 |
8.9 |
15.0 |
3 |
3 |
|
|
yes |
VT |
|
|
VA |
13 |
45.5 |
53.7 |
47 |
51 |
47.8 |
49.4 |
4.0 |
1.7 |
7.9 |
|
|
yes |
yes |
yes |
VA |
|
|
WA |
11 |
52.8 |
45.6 |
52 |
44 |
54.3 |
57.0 |
4.2 |
2.8 |
8.4 |
11 |
11 |
|
|
yes |
WA |
|
|
WV |
5 |
43.2 |
56.1 |
45 |
49 |
48.8 |
40.3 |
(2.9) |
(8.5) |
(5.8) |
|
|
|
yes |
|
WV |
|
|
WI |
10 |
49.7 |
49.3 |
51 |
44 |
54.0 |
52.0 |
2.4 |
(2.0) |
4.7 |
10 |
10 |
yes |
yes |
|
WI |
|
|
WY |
3 |
29.1 |
68.9 |
29 |
65 |
32.8 |
31.2 |
2.2 |
(1.5) |
4.3 |
|
|
yes |
yes |
|
WY |
|
|
|
|
|
|
|
|
|
|
|
|
|
|
|
|
|
|
|
|
|
|
|
|
|
|
|
|
|
|
|
|
|
|
|
|
|
|
|
|
|
|
|
|
|
|
|
|
|
|||||||||||||||||||||||||||||||||||||||||||||||||||||||||||||||||||||||||||||||||||||||||||||||||||||||||||||||||||||||||||||||||||||||||||||||||||||||||||||||||||||||||||||||||||||||||||||||||||||||||||||||||||||||||||||||||||||||||||||||||||||||||||||||||||||||||||||||||||||||||||||||||||||||||||||||||||||||||||||||||||||||||||||||||||||||||||||||||||||||||||||||||||||||
|
|
|
|
|
|
|
|
|
|
|
|
|
|
|
|
|
|
2004
Election Calculator |
|
|
|
|
|
|
|
|
|
|
|
|
|
|
|
|
|
|
|
|
|
|
|
|
|
|
|
|
|
|
|
|
|
2000 Recorded |
|
|
|
|
|
2004 Recorded |
|
|
|
||
|
|
|
Gore |
Bush |
Other |
Total |
|
|
|
Kerry |
Bush |
Other |
Total |
|
|
|
|
|
51.004 |
50.456 |
3.957 |
105.417 |
|
|
|
59.027 |
62.041 |
1.225 |
122.293 |
|
|
|
|
|
48.38% |
47.86% |
3.75% |
|
|
|
|
48.27% |
50.73% |
1.00% |
|
|
|
|
|
|
Uncounted |
|
|
|
|
|
|
Uncounted |
|
|
|
|
|
|
|
|
5.116 |
0.000 |
0.269 |
5.385 |
|
|
|
2.588 |
0.794 |
0.069 |
3.450 |
|
|
|
|
|
95% |
0% |
5% |
4.86% |
|
|
|
75% |
23% |
2% |
2.74% |
|
|
|
|
|
|
|
|
|
|
|
|
|
|
|
|
|
|
|
|
Uncounted Votes |
|
|
2000 Voter Share |
|
Final |
|
|
|
|
|
|
||
|
|
Percent
of votes cast |
Census |
Uncounted |
Kerry |
Estimate |
NEP |
NEP |
Sensitivity table: |
|
Start |
Increment |
|
||
|
|
2004 |
2.74% |
125.74 |
3.45 |
DNV |
57% |
57% |
54% |
Kerry
share of new (DNV) voters |
53% |
2.0% |
|
||
|
|
2000 |
4.86% |
110.80 |
5.38 |
Gore |
91% |
91% |
90% |
Kerry
share of Gore voters |
95% |
-2.0% |
|
||
|
|
|
|
|
|
Bush |
10% |
10% |
9% |
Gore
share of uncounted |
|
95% |
-10.0% |
|
|
|
|
2004 |
Share |
2000 |
Share |
Other |
64% |
64% |
71% |
Gore
voter turnout |
|
91% |
2.0% |
|
|
|
|
Kerry |
75% |
Gore |
75% |
|
|
|
|
|
|
|
|
|
|
|
|
Bush |
23% |
Bush |
0% |
Bush |
|
|
|
|
|
|
|
|
|
|
|
Other |
2% |
Nader |
5% |
DNV |
41% |
41% |
45% |
|
2004 Calculated |
|
|
|
|
|
|
|
|
|
|
Gore |
8% |
8% |
10% |
|
Kerry |
Bush |
Other |
|
|
|
|
2000 Voter Mortality |
|
|
Bush |
90% |
90% |
91% |
Cast |
67.03 |
56.98 |
1.74 |
|
|
|
|
|
Total
Voters |
1.22% |
|
|
Other |
17% |
17% |
21% |
Share |
53.31% |
45.31% |
1.38% |
|
|
|
|
Gore
share |
50.37% |
|
|
|
|
|
|
Exit
Poll |
51.80% |
47.20% |
1.00% |
|
|
|
|
|
|
|
|
Other |
|
|
|
Switched |
5.41 |
-5.86 |
0.45 |
|
|
|
|
2000 Voter Turnout in 2004 |
|
|
DNV |
2% |
2% |
1% |
Sw. Rate |
8.1% |
-10.3% |
25.6% |
|
|
|
|
|
Gore |
95% |
|
|
Gore |
1% |
1% |
0% |
|
|
|
|
|
|
|
|
Bush |
95% |
|
|
Bush |
0% |
0% |
0% |
|
|
|
|
|
|
|
|
Other |
95% |
|
|
Other |
19% |
19% |
8% |
|
|
|
|
|
|
|
|
|
|
|
|
|
|
|
|
|
|
|
|
|
|
|
|
|
|
|
|
|
|
|
|
|
|
|
|
|
|
|
|
|
2000 Recorded |
|
|
|
|
|
|
2004 Calculated |
|
|
|
||
|
|
Voted |
Recorded |
Uncounted |
Cast |
Deaths |
Alive |
|
Turnout |
Voted |
Weight |
Kerry |
Bush |
Other |
|
|
|
|
|
|
|
|
|
|
DNV |
27.91 |
22.2% |
57% |
41% |
2% |
|
|
|
Gore |
51.00 |
5.12 |
56.12 |
2.72 |
53.40 |
|
91% |
48.59 |
38.6% |
91% |
8% |
1% |
|
|
|
Bush |
50.46 |
0.00 |
50.46 |
2.48 |
47.98 |
|
95% |
45.58 |
36.2% |
10% |
90% |
0% |
|
|
|
Nader/other |
3.96 |
0.27 |
4.23 |
0.21 |
4.02 |
|
91% |
3.66 |
2.9% |
64% |
17% |
19% |
|
|
|
|
|
|
|
|
|
|
|
|
|
|
|
|
|
|
|
Total |
105.42 |
5.38 |
110.80 |
5.41 |
105.39 |
|
97.83 |
125.74 |
100% |
53.31% |
45.31% |
1.38% |
|
|
|
|
|
|
|
|
|
|
|
|
125.74 |
67.03 |
56.98 |
1.74 |
|
|
|
Press F9 to calculate tables |
|
|
|
|
|
|
|
|
|
|
|
|
|
|
|
|
|
Sensitivity Analysis |
|
|
|
|
|
Sensitivity Analysis |
|
|
|
||
|
|
|
|
Kerry National Vote |
|
|
|
|
|
Kerry National Vote |
|
|
|
||
|
|
Gore
share of |
|
|
|
|
|
|
Kerry
share of |
|
|
|
|
|
|
|
|
Uncounted
in 2000 |
Gore
Voter Turnout |
|
|
|
Gore
voters |
|
Share
of New voters (DNV in 2000) |
|
|
||||
|
|
53.3% |
91.0% |
93.0% |
95.0% |
97.0% |
99.0% |
|
53.3% |
53.0% |
55.0% |
57.0% |
59.0% |
61.0% |
|
|
|
95.0% |
53.3% |
53.6% |
53.9% |
54.2% |
54.5% |
|
95.0% |
54.0% |
54.4% |
54.8% |
55.2% |
55.6% |
|
|
|
85.0% |
53.0% |
53.3% |
53.6% |
53.9% |
54.1% |
|
93.0% |
53.2% |
53.6% |
54.0% |
54.4% |
54.8% |
|
|
|
75.0% |
52.7% |
52.9% |
53.2% |
53.5% |
53.8% |
|
91.0% |
52.4% |
52.8% |
53.2% |
53.6% |
54.0% |
|
|
|
65.0% |
52.3% |
52.6% |
52.9% |
53.2% |
53.5% |
|
89.0% |
51.6% |
52.0% |
52.4% |
52.8% |
53.3% |
|
|
|
55.0% |
52.0% |
52.3% |
52.6% |
52.9% |
53.1% |
|
87.0% |
50.8% |
51.2% |
51.7% |
52.1% |
52.5% |
|
|
|
|
|
|
|
|
|
|
|
|
|
|
|
|
|
|
|
|
|
Kerry
Margin (millions) |
|
|
|
|
|
Kerry
Margin (millions) |
|
|
|
||
|
|
|
|
|
|
|
|
|
|
|
|
|
|
|
|
|
|
10.05 |
91.0% |
93.0% |
95.0% |
97.0% |
99.0% |
|
10.05 |
53.0% |
55.0% |
57.0% |
59.0% |
61.0% |
|
|
|
95.0% |
10.1 |
10.8 |
11.5 |
12.3 |
13.0 |
|
95.0% |
11.8 |
12.8 |
13.8 |
14.9 |
15.9 |
|
|
|
85.0% |
9.2 |
10.0 |
10.7 |
11.4 |
12.2 |
|
93.0% |
9.8 |
10.8 |
11.9 |
12.9 |
13.9 |
|
|
|
75.0% |
8.4 |
9.1 |
9.9 |
10.6 |
11.3 |
|
91.0% |
7.8 |
8.8 |
9.9 |
10.9 |
11.9 |
|
|
|
65.0% |
7.6 |
8.3 |
9.0 |
9.8 |
10.5 |
|
89.0% |
5.8 |
6.9 |
7.9 |
8.9 |
9.9 |
|
|
|
55.0% |
6.8 |
7.5 |
8.2 |
8.9 |
9.6 |
|
87.0% |
3.8 |
4.9 |
5.9 |
6.9 |
7.9 |
|
|
|
|
|
|
|
|
|
|
|
|
|
|
|
|
|
|
|
|
|
|
|
|
|
|
|
|
|
|
|
|
|
|
|
|
|
|
|
|
|
|
|
|
|
|
|
|
|
|
|
|
|
Sensitivity Analysis |
|
|
|
|
|
Sensitivity Analysis |
|
|
|
||
|
|
|
|
Kerry National Vote |
|
|
|
|
|
Kerry National Vote |
|
|
|
||
|
|
Bush
2000 Voter |
|
|
|
|
|
|
Kerry
share of |
|
|
|
|
|
|
|
|
Turnout
in '04 |
|
Gore Voter
Turnout in '04 |
|
|
|
Gore
voters |
|
Share
of Bush voters |
|
|
|
||
|
|
53.3% |
91.0% |
93.0% |
95.0% |
97.0% |
99.0% |
|
53.3% |
8.0% |
9.0% |
10.0% |
11.0% |
12.0% |
|
|
|
91.0% |
53.4% |
53.7% |
54.0% |
54.3% |
54.5% |
|
95.0% |
54.1% |
54.4% |
54.8% |
55.2% |
55.6% |
|
|
|
93.0% |
53.0% |
53.3% |
53.6% |
53.9% |
54.2% |
|
93.0% |
53.3% |
53.7% |
54.0% |
54.4% |
54.8% |
|
|
|
95.0% |
52.7% |
52.9% |
53.2% |
53.5% |
53.8% |
|
91.0% |
52.5% |
52.9% |
53.2% |
53.6% |
54.0% |
|
|
|
97.0% |
52.3% |
52.6% |
52.9% |
53.2% |
53.4% |
|
89.0% |
51.7% |
52.1% |
52.4% |
52.8% |
53.2% |
|
|
|
99.0% |
51.9% |
52.2% |
52.5% |
52.8% |
53.1% |
|
87.0% |
50.9% |
51.3% |
51.7% |
52.0% |
52.4% |
|
|
|
|
|
|
|
|
|
|
|
|
|
|
|
|
|
|
|
|
|
Kerry
Margin (millions) |
|
|
|
|
|
Kerry
Margin (millions) |
|
|
|
||
|
|
|
|
|
|
|
|
|
|
|
|
|
|
|
|
|
|
10.05 |
91.0% |
93.0% |
95.0% |
97.0% |
99.0% |
|
10.05 |
8.0% |
9.0% |
10.0% |
11.0% |
12.0% |
|
|
|
91.0% |
10.3 |
11.0 |
11.7 |
12.5 |
13.2 |
|
95.0% |
12.0 |
12.9 |
13.8 |
14.8 |
15.7 |
|
|
|
93.0% |
9.4 |
10.1 |
10.8 |
11.5 |
12.3 |
|
93.0% |
10.0 |
10.9 |
11.9 |
12.8 |
13.7 |
|
|
|
95.0% |
8.4 |
9.1 |
9.9 |
10.6 |
11.3 |
|
91.0% |
8.0 |
8.9 |
9.9 |
10.8 |
11.7 |
|
|
|
97.0% |
7.5 |
8.2 |
8.9 |
9.6 |
10.4 |
|
89.0% |
6.0 |
6.9 |
7.9 |
8.8 |
9.7 |
|
|
|
99.0% |
6.5 |
7.3 |
8.0 |
8.7 |
9.4 |
|
87.0% |
4.0 |
5.0 |
5.9 |
6.8 |
7.8 |
|
|
|
|
|
|
|
|
|
|
|
|
|
|
|
|
|