LABORATORY TESTSFOR DETERMINATION OFSOIL SHEAR STRENGTH PARAMETERSIntroduction
There
are several laboratory methods now available to determine the shear strength
parameters (i.e., c, f,
c�, f�) of various soil specimens in the laboratory.
They are as follows: 1.
Direct Shear Test (DST) 2.
Triaxial Test a.
Unconsolidated Undrained (UU) b.
Consolidated Undrained (CU) c.
Consolidated Drained (CD) 3.
Unconfined Compression Test (UCT) 4.
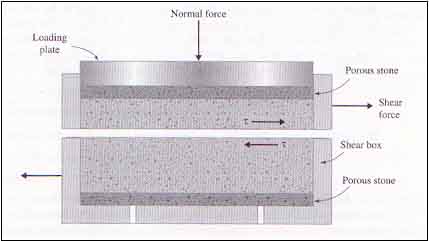
Direct Simple Shear Test 5. Plane Strain Triaxial Test 6. Torsional Ring Shear Test The direct shear test and the triaxial test are the two commonly used techniques for determining the shear strength parameters. The UCT is a special type of UU test. These two tests are described in detail in this paper. Direct Shear TestThe direct shear test is the oldest and simplest form of
shear test arrangement. A
diagram of the direct shear test apparatus is shown in Figure 1. The test equipment consists of a metal shear box in which the
soil specimen is placed. The
soil specimens may be square or circular in plan.
The size of specimens generally used is about 51 mm x 51 mm or 102 mm
x 102 mm (2 in. x 2 in. or 4 in. x 4 in.) across and about 25 mm (1 in.)
high. The box is split
horizontally into halves. Normal
force on the specimen is applied from the top of the shear box. The normal stress on the specimen can be as great as 1050 kPa
(150 psi). Shear force is applied by moving one-half of the box relative to
the other to cause failure in the soil specimen.
There are two types of DST: 1.
Stress-controlled tests
- the shear force is applied in equal increments until the specimen fails.
The incremental load is applied on the top half of the box.
The change in the height of the specimen during the test can be
obtained from the readings of a dial gauge that measures the vertical
movement of the upper loading plate. 2.
Strain-controlled tests
- a constant rate of shear displacement is applied to one-half of the box by
a motor that acts through gears. The
volume change of the specimen during the test is obtained in a manner
similar to that in stress-controlled tests. The difference: Strain controlled
tests allow plotting of peak shear resistance as well as lesser shear
resistance (that is, a point after failure called ultimate strength)
can be observed and plotted. Nevertheless,
compared with strain-controlled tests, stress-controlled tests probably
model real field situations better. For a given test, the normal
stress can be calculated as
The resisting shear stress for any
shear displacement can be calculated as
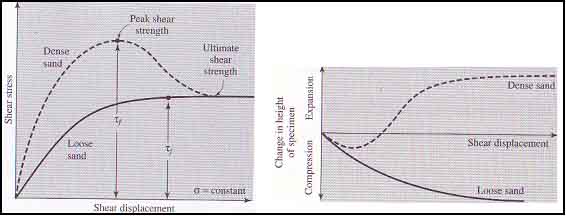
Figure 2 shows a typical plot of shear stress and change in
the height of the specimen against shear displacement for dry loose and
dense sands. These observations
were obtained from a strain-controlled test.
The following generalizations can be developed from Figure 2
regarding the variation of resisting shear stress with shear displacement: 1.
In loose sand, the resisting shear stress increases with
shear displacement until a failure shear stress tf is reached.
After that, the shear resistance remains approximately constant for
any further increase in the shear displacement. 2.
In dense sand, the resisting shear stress increases with
shear displacement until it reaches a failure stress of tf�. This tf
is called the peak shear strength.
After failure stress is attained, the resisting shear stress
gradually decreases as shear displacement increases until it finally reaches
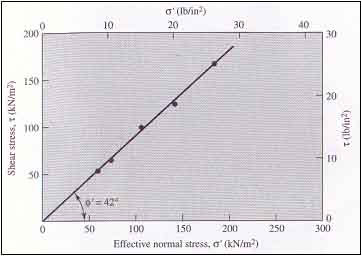
a constant value called the ultimate shear strength. It is important to note that in dry sand, the effective
stress is equal to the total stress and the cohesion, c, is zero. Direct hear tests are repeated on similar specimens at various normal stresses. The normal stresses and the corresponding values of tf obtained from a number of tests are plotted on a graph from which the shear strength parameters are determined.
Figure 3 shows such a plot for tests on dry sand. The
equation for the average line obtained from experimental results is
so the friction angle can be determined as follows:
It is important to note that in
situ cemented sands may show a c� intercept. A. Drained DST on Saturated Sand and Clay
In the direct shear test arrangement, the shear box that
contains the soil specimen is generally kept inside a container that can be
field with water to saturate the specimen.
A drained test is made on a saturated soil specimen by keeping
the rate of loading slow enough so that the excess pore water pressure
generated in the soil is completely dissipated by drainage.
Pore water from the specimen is drained through two porous stones.
Because the hydraulic conductivity of sand is high, the excess pore water pressure generated due to loading (normal and shear) is dissipated quickly. Hence, for an ordinary loading rate, essentially full drainage conditions exist. The friction angle, f�, obtained from a drained direct shear test of saturated sand will be the same as that of similar specimen of dry sand. The hydraulic conductivity of clay
is very small compared with that of sand.
When a normal load is applied to a clay soil specimen, a sufficient
length of time must elapse for full consolidation�that is, for dissipation
of excess pore water pressure. For
this reason, the shearing load must be applied very slowly.
The test may last from two to five days.
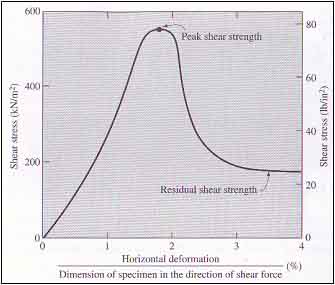
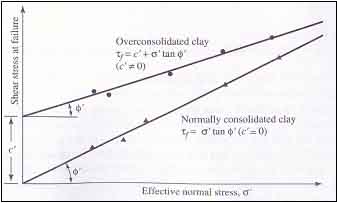
Figure 4 shows the results of a
drained direct shear test on over-consolidated clay. Figure 5 shows the plot of tf
against s� obtained from a number of drained direct shear tests
on a normally consolidated and over-consolidated clay.
Note that the value of c� � 0 for a normally consolidated
clay.
B. General Comments on Direct
Shear Test The direct shear test is the simplest to perform and most economical for a dry or saturated sandy soil, but it has some disadvantages. The reliability of the results may be questioned because the soil is not allowed to fail along the weakest plane but is forced to fail along the plane of the split of the shear box. Equally important, the shear stress distribution over the shear surface of the specimen is not uniform.
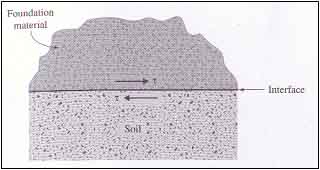
In many foundation design
problems, one must determine the angle of friction between the soil and the
material in which the foundation is constructed (Figure 6). The foundation
material may be concrete, steel, or wood.
The shear strength along the surface of contact of the soil and the
foundation can be given as
where ca� = adhesion d
= effective angle of friction
between the soil and foundation material The shear strength parameters between a soil and a foundation material can be conveniently determined by a direct shear test. This is a great advantage of the direct shear test, and then the soil can be placed above it (that is, in the top part of the box) and the test can be conducted in the usual manner.
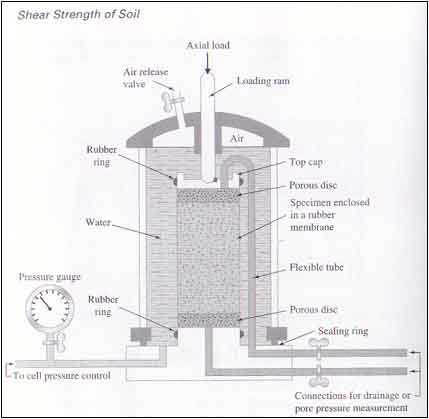
The triaxial shear test is one of the most reliable methods available for determining shear strength parameters. It is widely used for research and conventional testing. A diagram of the triaxial test layout is show in Figure 7.
In this test, a soil specimen
about 36 mm (1.4 in.) in diameter and 76 mm (3 in.) long is generally used.
The specimen is encased in a thin rubber membrane placed inside a
plastic cylindrical chamber that is usually filled with water or glycerine.
The specimen is subjected to a confining pressure by compression of the
fluid in the chamber. To cause shear failure in the specimen, one must apply axial
stress through a vertical loading ram (deviator sress). This stress
can be applied in one of the two ways:
The axial load applied by the
loading ram corresponding to a given axial deforamtion is measured by a
proving ring or load cell attached to the ram. Connections to measure
drainage into or out of the specimen, or to measure pressure in the pore
water (as per the test conditions), are also provided.
The following three standard types of triaxial tests are generally
conducted:
A.
Consolidated-Drained (CD) Triaxial Test
In the CD test, the saturated
specimen is the first subjected to an all-around confining pressure, s3, by
compression of the chamber. As
confining pressure is applied, the pore water pressure of the specimen
increases by uc (if drainage is prevented).
This increase in the pore water pressure can be expressed as a
non-dimensional parameter in the form
where B = Skempton�s pore pressure parameter (Skempton,
1954). For saturated soft soils, B is approximately equal to 1;
however, for saturated stiff soils, the magnitude of B can be less than 1.
Black and Lee (1973) gave the theoretical values of B for various
soils at complete saturation. These values are listed in Table 1.
Table 1 Theoretical values of B at complete saturation.
If the connection to drainage is
opened, dissipation of the excess pore water pressure, and thus
consolidation, will occur. With
time, uc, will become equal to 0. In saturated soil, the
change in the volume of the specimen (DVc)
that takes place during consolidation can be obtained from the volume of
pore water drained. The
deviator stress, Dsd, on the specimen is increased
very slowly. The drainage
connection is kept open, and the slow rate of deviator stress application
allows complete dissipation of any pore water pressure that developed as a
result (Dud = 0).
Because the pore water pressure
developed during the test is completely dissipated, we have total and effective confining stress = s3
= s�3
(7) and total and effective axial stress at failure = s3 + (Dsd)f = s1 = s�1
(8) In a triaxial test, s�1 is the major principal effective
stress at failure and s�3
is the minor principal effective stress at failure.
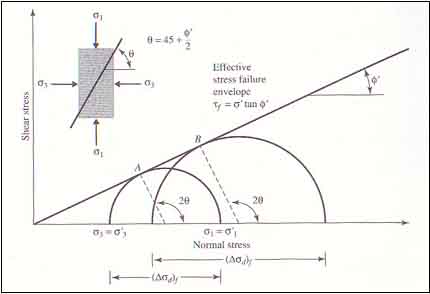
Several tests on similar specimens can be conducted by varying the confining pressure. With the major and minor stresses at failure for each test the Mohr�s circles can be drawn and the failure envelopes can be obtained. Figure 8 shows the type of effective stress failure envelope obtained for tests on sand and normally consolidated clay. The coordinates of the point of tangency of the failure envelope with a Mohr�s circle (that is, point A) give the stresses (normal) and shear) on the failure plane of that test specimen.
Over-consolidation results when clay is initially consolidated under an all-around chamber pressure of sc (= s�c) and is allowed to swell by reducing the chamber pressure to s3 (= s�3). The failure envelope obtained from drained triaxial tests of such over-consolidated clay specimens shows two distinct branches. The first of which has a flatter slope with a cohesion intercept, and the shear strength equation for this branch can be written as
The second portion of the failure envelope represents a
normally consolidated stage of soil and follows the equation
A
consolidated-drained triaxal test on a clayey soil may take several days to
complete. This amount of time is required because deviator stress must
be applied very slowly to ensure full drainage from the soil specimen.
For this reason, the CD type of triaxial test is uncommon.
B. Comments
on Drained and Residual Friction Angles of Clays
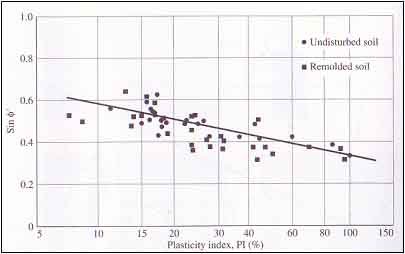
The drained angle of friction, f�, generally decreases with the
plasticity index of soil. This fact is illustrated in Figure 9 for a number
of clays from data reported by Kenney (1959).
Although the data are considerably scattered, the general pattern
seems to hold. At a very high clay content, fr� approaches the value of the angle of sliding friction for
sheet minerals. For highly
plastic sodium montmorillonites, the magnitude of fr� may be as low as 3 to 4�.
C. Consolidated-Undrained Triaxial Test
The consolidate-unrained test is the most common type of triaxial test. In this test, the saturated soil specimen is first consolidated by an all-around chamber fluid pressure, s3, that results in drainage. After the pore water pressure generated by the application of confining pressure is dissipated, the deviator stress, Dsd, on the specimen is increased to cause shear failure. During this phase of the test, the drainage line from the specimen is kept closed. Because drainage is not permitted, the pore water pressure, Dud, will increase. During the test, simultaneous measurements of Dsd and Dud are made. The increase in the pore water pressure, Dud��, can be expressed in a non-dimensional form as
where
In loose sand and normally
consolidated clay, the pore water pressure increases with strain to a
certain limit, beyond which it decreases and becomes negative (with respect
to the atmospheric pressure). This
decrease is because of a tendency of the soil to dilate.
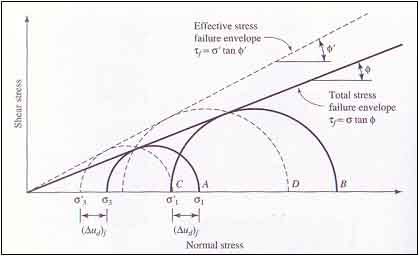
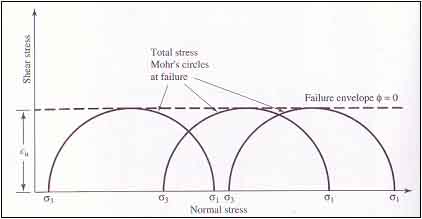
Tests on several similar specimens
with varying confining pressures may be conducted to determine the shear
strength parameters. Figure 10 shows the total and effective stress Mohr�s
circles at failure obtained from consolidated-undrained triaxial tests in
sand and normally consolidated clay. Note
that A and B are two total stress Mohr�s circles obtained from two tests.
C and D are the effective stress Mohr�s circles corresponding to
total stress circles A and B, respectively.
The diameters of circles A and C are the same; similarly, the
diameters of circles B and D are the same. In Figure 10, the total stress
failure envelope can be obtained by drawing a line that touches all the
total stress Mohr�s circles. For
sand and normally consolidated clays, this will be approximately a straight
line passing through the origin and may be expressed by the equation
where s = total stress f
= the angle that the total stress failure envelope makes with the normal
stress axis, also known as the consolidated-undrained angle of shearing
resistance
Again
referring to Figure 10, we see that the failure envelope that is tangent to
all the effective stress Mohr�s circles can be represented by the equation
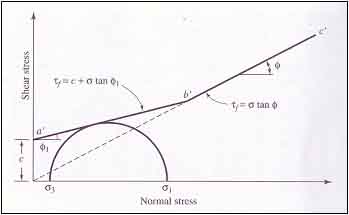
as that from consolidated-drained tests. In over consolidated clays, the
total stress failure envelope obtained from consolidated-undrained tests
will take the shape shown in Figure 11.
The straight line a�b� is represented by the equation
and the straight line b�c� follows the relationship given by Eq. 12. The effective stress failure envelope drawn from the effective stress Mohr�s circles will be similar to that shown in Figure 11.
Consolidated-drained
tests on clays soils take considerable time.
For this reason, consolidated-undrained tests can be conducted on
such soils with pore pressure measurements to obtain the drained shear
strength parameters. Because
drainage is not allowed in these tests during the application of deviator
stress, they can be performed quickly. Skempton�s
pore water pressure parameter
The general range of
D.
Unconsolidated-Undrained Triaxial Test
Drainage from the soil specimen
is not permitted during the application of chamber pressure s3 In
unconsolidated-undrained tests. The
test specimen is sheared to failure by the application of deviator stress, Ds3, and
drainage is prevented. Because
drainage is not allowed at any stage, the test can be performed quickly.
Because of the application of chamber confining pressure s3, the pore
water pressure in the soil specimen will increase by uc.
A further increase in the pore water pressure (Dud) will
occur because of the deviator stress application. This test is usually conducted on clay specimens and depends
on a very important strength concept for cohesive soils if the soil is fully
saturated. The added axial
stress at failure (Dsd)f
is practically the same regardless of the chamber confining pressure. This
property is shown in Figure 12. The
failure envelope for the total stress Mohr�s circles becomes a horizontal
line and hence is called a f
= 0 condition. Thus, we have
where cu = undrained shear strength and is equal to the radius of Mohr�s circles. Note that the f = 0 concept is applicable to only saturated clays and
silts.
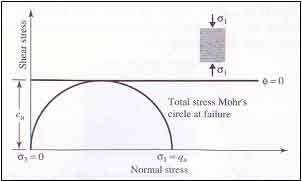
Unconfined
Compression Test (UCT) The
unconfined compression test is a special type of unconsolidated-undrained
test that is commonly used for clay specimens.
In this test, the confining pressure s3 is 0. An
axial load is rapidly applied to the specimen to cause failure.
At failure, the total minor principal stress is zero and the total
major prinicipl stress is s1 . Figure 13 shows a result
of an UCT.
Because the undrained shear strength is independent of the confining pressure as long as the soil is fully saturated and fully undrained, we have
| ||||||||||||||||||||||||||||||||||||||||||||||||||||||||||||
Consistency
|
qu
|
|
kN/m2
|
ton/ft2
|
|
Very soft
|
0-25
|
0-0.25
|
Soft
|
25-50
|
0.25-0.50
|
Medium
|
50-100
|
0.50-1
|
Stiff
|
100-200
|
1-2
|
Very stiff
|
200-400
|
2-4
|
Hard
|
>400
|
>4
|
[1] Bowles, Joseph E., Engineering Properties of Soils and Their Measurements,
3rd
edition, 1986.
[2] Das, Braja M., Principles
of Geotechnical Engineering, 5th edition, 2002.
[3] Geotechnical Engineering
Manual