
|
|
Topic : Function
Quadratic
y =
ax
![]() +
c
+
c
Method of teaching : THINK-PAIR-SHARE
TIME : 2 HOURS
Level : Form 4
Project Structure : With the help of graphic calculator, students are guided to investigate the effect of varying the value of a and c on the shape and position of the graph of quadratic function.
Using the conjectures they found, the students are required to correlate any given graph with the most probable function. The students further predict and investigate quadratic function which involve 'a' as a fraction or decimal.
Objective: (1)To sketch the graph of quadratic function using graphic calculator
(2)To study the effect of varying the value of 'a' on the shape and position of the graph.
(3) To study the effect of varying the value of c on the shape and position of the graph.
(4) To determine whether the vertex of the graph is the highest point or lowest point on the graph.
(5) To identify the axis of symmetry of the graph sketched
(6) To correlate a given graph (quadratic function) with the appropriate function.
Materials needed : Graphic calculator / worksheet.
Technology knowledge in graphic calculator : intermediate.
|
ACTIVITIY
1
INTRODUCTION |
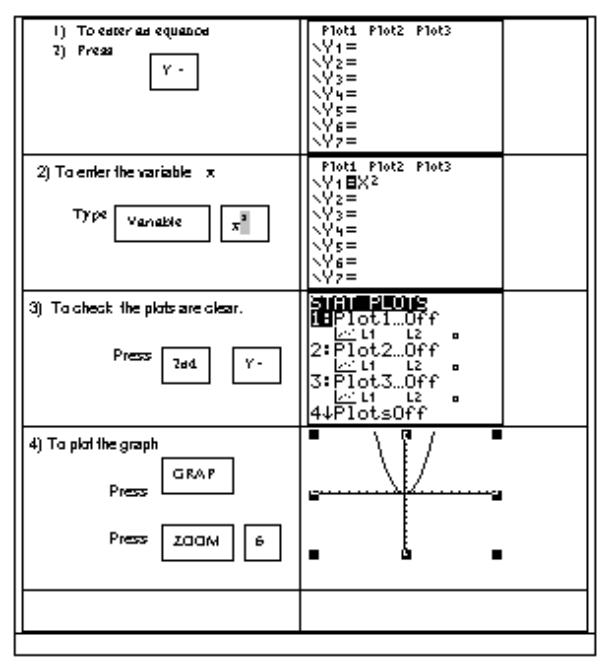
Example 1 : To plot the graph using the graphic calculator.
y = x
![]() STEPS
STEPS
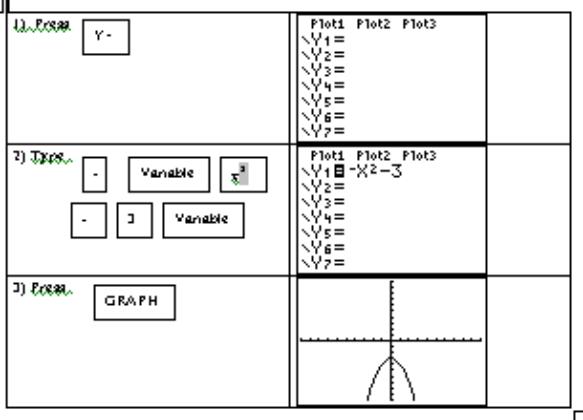
EXAMPLE 2
To plot the graph of y
= -x
![]() -3
-3
Steps:
|
ACTIVITY 2 |
|
WORKSHEET
1 |
y = ax
![]() + c
+ c
Use graphic calculator to graph the following functions
|
Function |
Sketch |
Value of v and c in y = ax
|
Does the parabola open up or down |
Coordinates of the vertex at the highest point or lowest point of the graph |
|
|
a |
c |
||||
|
a) y = x
|
|
|
|
|
|
|
b) y = 2x
|
|
|
|
|
|
|
c) y = 3x
|
|
|
|
|
|
|
d) y = -x
|
|
|
|
|
|
|
e) y = -4x
|
|
|
|
|
|
Questions:
1. (a) Which of the graphs open up?
Answer: .............................................
(b) Which of the graphs open down?
Answer : ...................................................
2. Describe what happens to the shape and position of the graph as the value of a and c changes.
|
a |
Graph open up or down |
Vertex is the highest or lowest point on the graph |
|
a > 0 |
|
|
|
a < 0 |
|
|
WORKSHEET 2 |
|
|
Function |
Sketch |
Value of a and c in
|
Coordinate Vertex |
Axis symmetry |
|
|
a |
c |
||||
|
|
|
|
|
|
|
|
|
|
|
|
|
|
|
|
|
|
|
|
|
|
|
|
|
|
|
|
|
|
|
|
|
|
|
Conclusion:
(1) Describe how the graph of y = x
![]() + c
changes if a is kept constant and c varies.
+ c
changes if a is kept constant and c varies.
|
c |
Move up or down |
|
c> 0 |
|
|
c< 0 |
|
(2) Predict which of the graph is higher up
(i) y
= 3x
![]() + 1
+ 1
(ii)
y = 3x
![]() - 1
- 1
Check you answer with the graphic calculator.
WORKSHEET
3
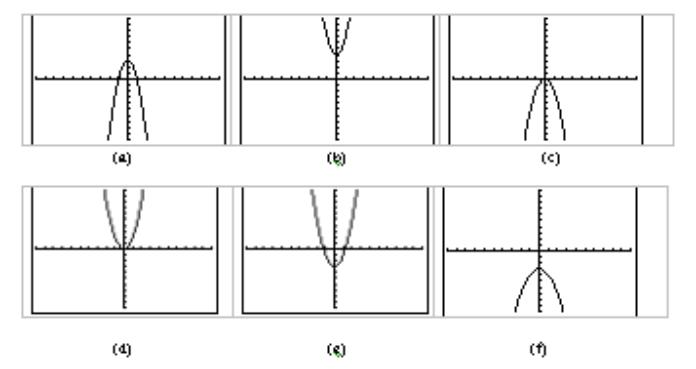
Based on the value of a and c in y = ax
![]() + c, try to match the following graphs to the appropriate quadratic function.
+ c, try to match the following graphs to the appropriate quadratic function.
Graphs:
Quadratic functions:
1.
![]() 4.
4.
![]() 7.
7.
![]()
2.
![]() 5.
5.
![]() 8.
8.
![]()
3.
![]() 6.
6.
![]() 9.
9.
![]()
Answers : a) Þ b) Þ c) Þ
d) Þ e) Þ f) Þ
WORKSHEET
4
(1) Sketch the graph
y =
![]() x + 3
x + 3
|
Confirm your answer using graphic calculator.
(2) Given the function
y =
![]() x
+ 3
x
+ 3
(a) Sketch the graph above on the same graph paper as (1)
(b) Sketch the graph using graphic calculator
(3) (a) Can you sketch the graph for
y = 0.2 x – 3
(b) Sketch the graph using graphic calculator and compare your answer.
************* END ******************