| MENU |
| --------------- |
| ------- |
| ----- |
| Smart Dust |
| Biosensors |
| Body Area Network |
| Cyber Physical Systems |
| Digital Twin |
| Energy Harvesting |
| Epigenetics |
| Graphene |
| Hydrogels |
| Molecular Communication |
| Microfluidics |
| Neuromorphics |
| Optogenetics |
| Precision Medicine |
| Quantum Dots |
| Synthetic Biology |
| Terahertz Radiation |
| Virtual Reality |
| Xenobots |
| Cognitive Warfare |
| Brain Transparency |
| Quantum Signals |
| Quantum Shielding |
| Scalar Waves |
| Entanglements |
| Physiochemical |
| BioCyber Interface |
| Psionics |
| Telemetry |
| ------------------------ |
| ------------- |
| ------- |
| --- |
| -- |
| - |
o o o o o o o o o o o o o o oo o o o o o o o o oo o o o o oo o o oo o oo oo oo o o o o o |
|


|
|

|
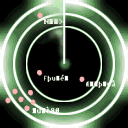
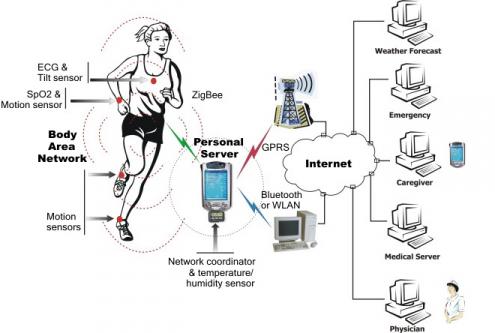
WHAT IS A WIRELESS BODY AREA NETWORK [WBAN] ?
|
Definitions:
 |
| Introduced since 1971 for remote healthcare monitoring.
A Wireless Body Area Network (WBAN) is a specialized wireless network designed to connect and communicate with sensors and devices located on, in, or around the human body. It enables real-time monitoring of physiological data and facilitates communication between these devices for various applications, particularly in healthcare.
A Wireless Body Area Network (WBAN) connects independent nodes (e.g. sensors and actuators) that are situated in the clothes, on the body or under the skin of a person. The network typically expands over the whole human body and the nodes are connected through a wireless communication channel. According to the implementation, these nodes are placed in a star or multihop topology. (https://www.waves.intec.ugent.be/research/wireless-body-area-networks) |
|
 |
Body Area Network is a process for organizing human beings -- both individually and collectively -- into sets of nodes that are linked together according to the medical, political, economic, and social philosophies of the people who have appointed themselves as regulatory overlords with respect to such networks.
A WBAN offers many promising new applications in the area of remote health monitoring, home/health care, medicine, multimedia, sports and many other, all of which make advantage of the unconstrained freedom of movement a WBAN offers. In the medical field, for example, a patient can be equipped with a wireless body area network consisting of sensors that constantly measure specific biological functions, such as temperature, blood pressure, heart rate, electrocardiogram (ECG), respiration, etc.
|
|
 |
 |
WPAN: Wireless Personal Area Network. Is a type of short-range wireless network used to connect devices within a small area, typically within a person's personal space. Examples include connecting a smartphone to a headset, or a home appliance to a smart hub.
WBAN: Wireless Body Area Network. It's a type of wireless sensor network that uses low-power devices to collect and transmit data from or around the human body. These networks are designed for applications like health monitoring, medical applications, and even non-medical purposes.
ILLUSTRATIONS
 https://www.sciencedirect.com/science/article/abs/pii/S2211285524002441 https://www.sciencedirect.com/science/article/abs/pii/S2211285524002441
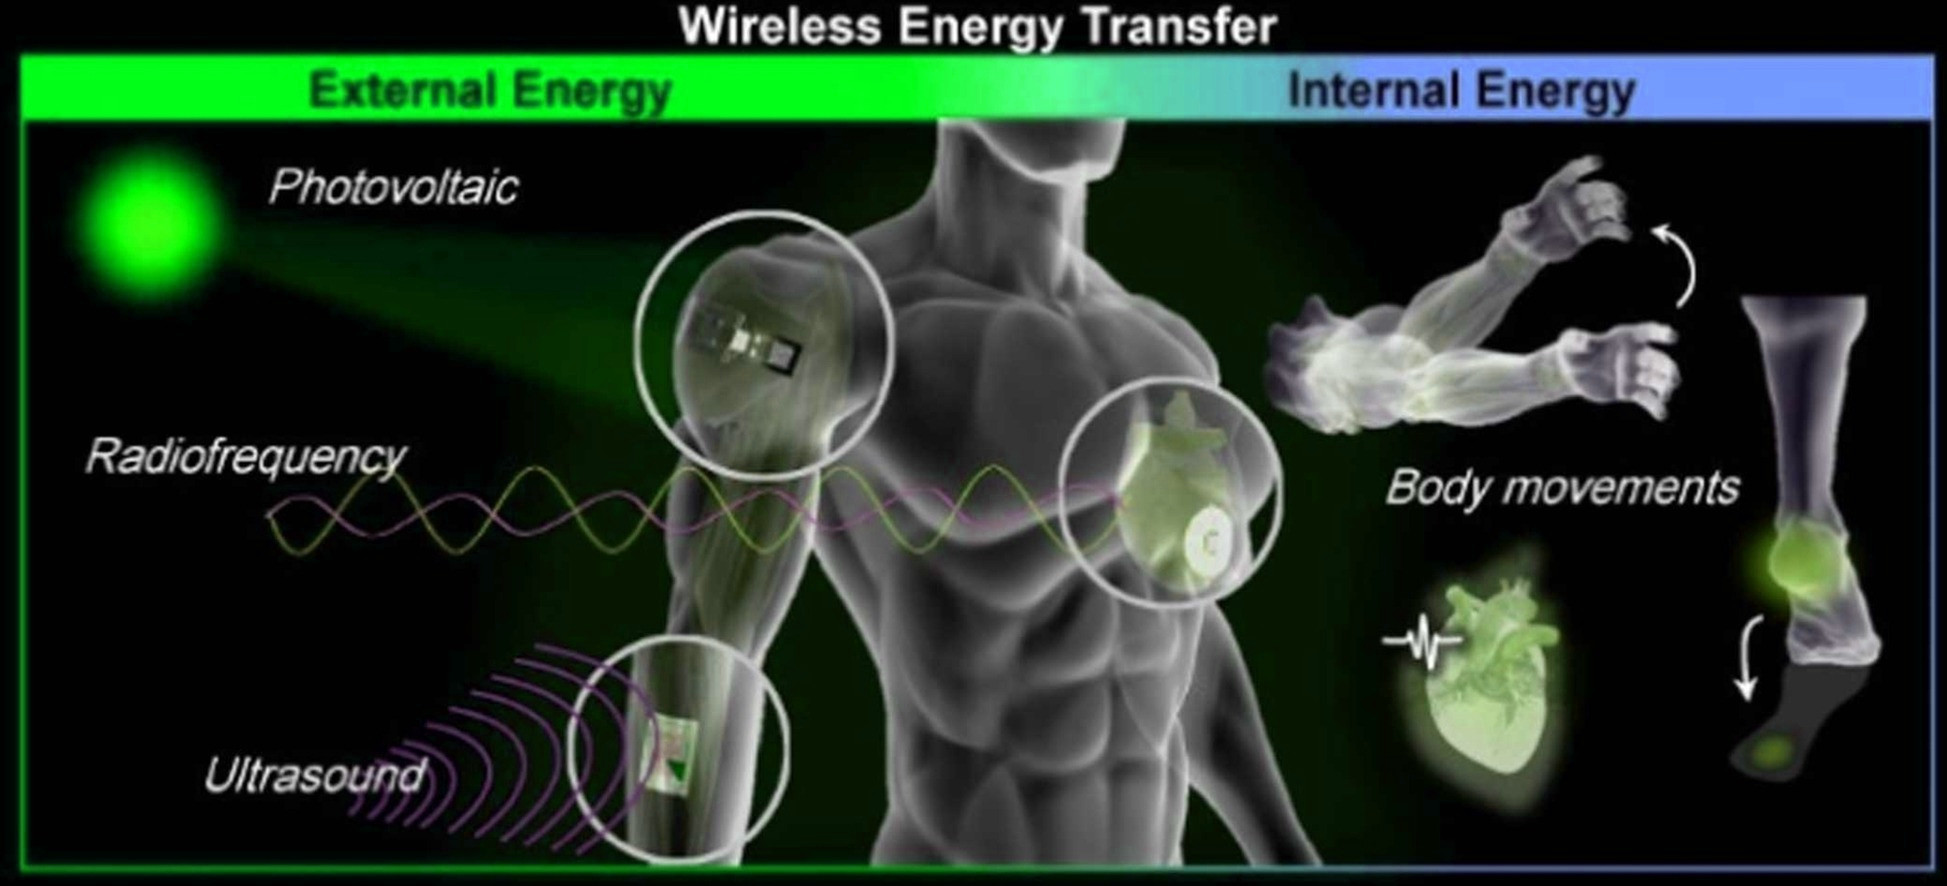
Wireless energy transfer (WET) technology has been extensively explored over the past decades as an ideal solution for supplying energy to body-interfaced electronics. The utilization of wireless, battery-free devices powered by WET offers high potential for conformal applications in body interfaces, particularly by accommodating repetitive body movements and ensuring a robust power supply. Owing to these attractive features, WET can serve as an alternative to conventional batteries for body-interfaced electronics, addressing challenges including the periodic replacement of batteries, size constraints in a limited target area, and intrinsic rigidity. Furthermore, the untethered system of WET can eliminate the obstruction of user movement, leading to improved applicability of body-interfaced electronics in daily life. In this review, we categorize WET technologies based on their energy sources, distinguishing between external energy obtained from outside the body and internal energy obtained from the body itself. We conducted a comprehensive review of strategies for applying WET technology in body-interfaced electronics, along with recent advances that have adopted unconventional approaches. Furthermore, this review provides additional perspectives on future directions for more practical applications of WET-based body-interfaced devices.
From sensing to energy savings: A comprehensive survey on integrating emerging technologies for energy efficiency in WBANs
 https://doi.org/10.1016/j.dcan.2024.11.012 https://doi.org/10.1016/j.dcan.2024.11.012
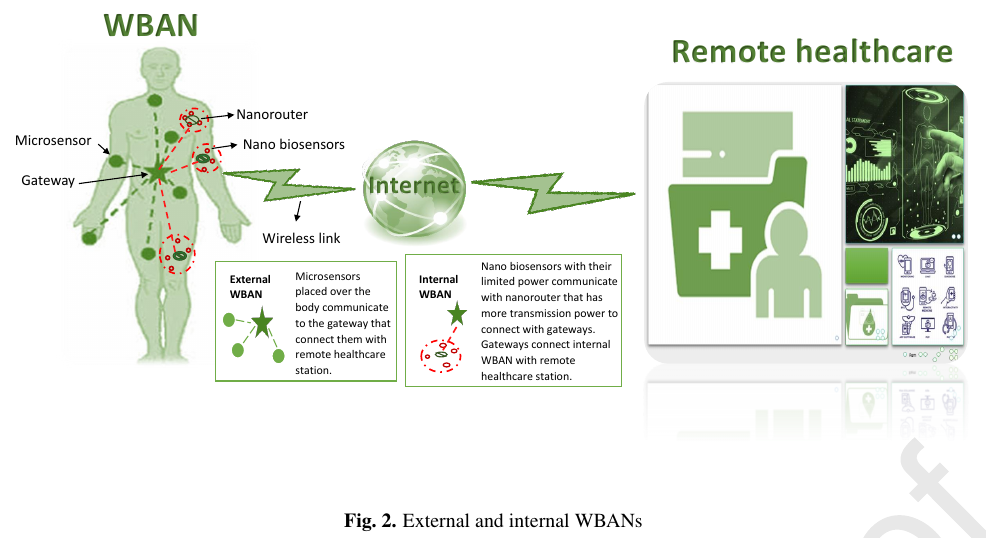
Fig. 2 presents an internal/external WBAN architecture and its connectivity with a remote healthcare station using the Internet.
Energy is essential for human existence, and its high consumption is a growing concern in today's technology-driven society. Global initiatives aim to reduce energy consumption and pollution by developing and deploying energy-efficient sensing technologies for long-term monitoring, control, automation, security, and interactions. Wireless Body Area Networks (WBANs) benefit a lot from the continuous monitoring capabilities of these sensing devices, which include medical sensors worn on or implanted in the human body for healthcare monitoring.
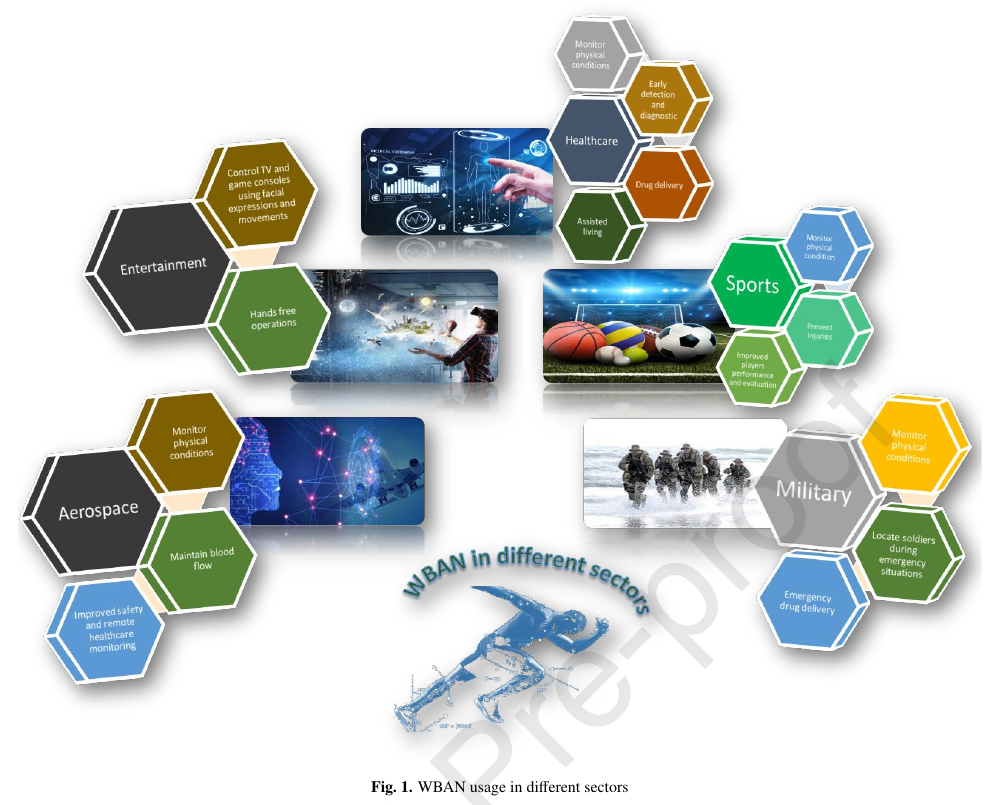
Since the introduction of WBAN in 1971 for remote healthcare monitoring, many other sectors have adopted WBAN technologies as describe below.
1. Healthcare: The adoption of WBANs in healthcare has transformed traditional healthcare systems. For example, remote healthcare monitoring and delivery have brought significant ease and comfort for chronic and elderly patients, and they also play a major role in reducing the administrative load of hospital systems [18]. In addition, implanted nanosensors with their ability to provide more accurate information about the abnormal cell's growth are considered a breakthrough for early cancer and kidney failure detection [19]. Furthermore, WBANs also have huge potential for assisted living as caregivers can continuously monitor the health conditions of the elderly and adults to provide enhanced care, privacy, and comfort.
2. Military: Lightweight sensing devices worn by soldiers or military personnel can help manage and predict their physiological conditions. For example, sensing devices can record the physiological response of soldiers during missions and training. Moreover, during an emergency, a WBAN can assist in tracking the location of soldiers and provide information about their activity levels [20], [21]. In addition to remote monitoring, WBANs can also be used for accurate drug delivery. For example, nano actuators can provide drug administration if a soldier suffers from low glucose levels and needs immediate medicine during a mission.
3. Aerospace: The flying coveralls have air ducts that are used to maintain blood flow due to increasing or decreasing oxygen levels during harsh conditions in aerospace. WBANs can be embedded in the flying coveralls for improved monitoring of the oxygen level, blood pressure, and temperature. Furthermore, a WBAN connection with the base station can also provide better remote healthcare monitoring, management, and safety of persons involved in air and space travel.
4. Sports: Physiological sensors can monitor athletes' temperature, humidity, or blood pressure levels and help improve their performance and prevent any physical damage due to high blood pressure or any other abnormal physical condition In addition, a WBAN also enable close monitoring and safety of players in different sports. For example, in a baseball game, a head injury due to a ball hit can also be predicted by sensors in the helmet that can measure the force or impact of the hit to determine the grade of concussion. Furthermore, optic sensors can track the best finger position based on the pitch throw of players. The detailed tracking of players can also help gain insights into their strengths and peak performance levels [22], [23], [24].
5. Entertainment: WBANs have already been used to control TV, game consoles, and virtual reality applications based on facial expressions and body movements. In-car infotainment equipment also integrates sensors and speech recognition technology to enable hands-free operation. Furthermore, it is expected that many other kinds of sensing technologies will be adopted in a progressively larger set of entertainment applications soon, such as eye and gaze tracking [25], bio-signal interpretation [26], rehabilitation games, and haptic feedback [27]. Figure 1 summarizes the use of WBANs in different sectors.
 https://doi.org/10.1016/j.dcan.2024.11.012 https://doi.org/10.1016/j.dcan.2024.11.012
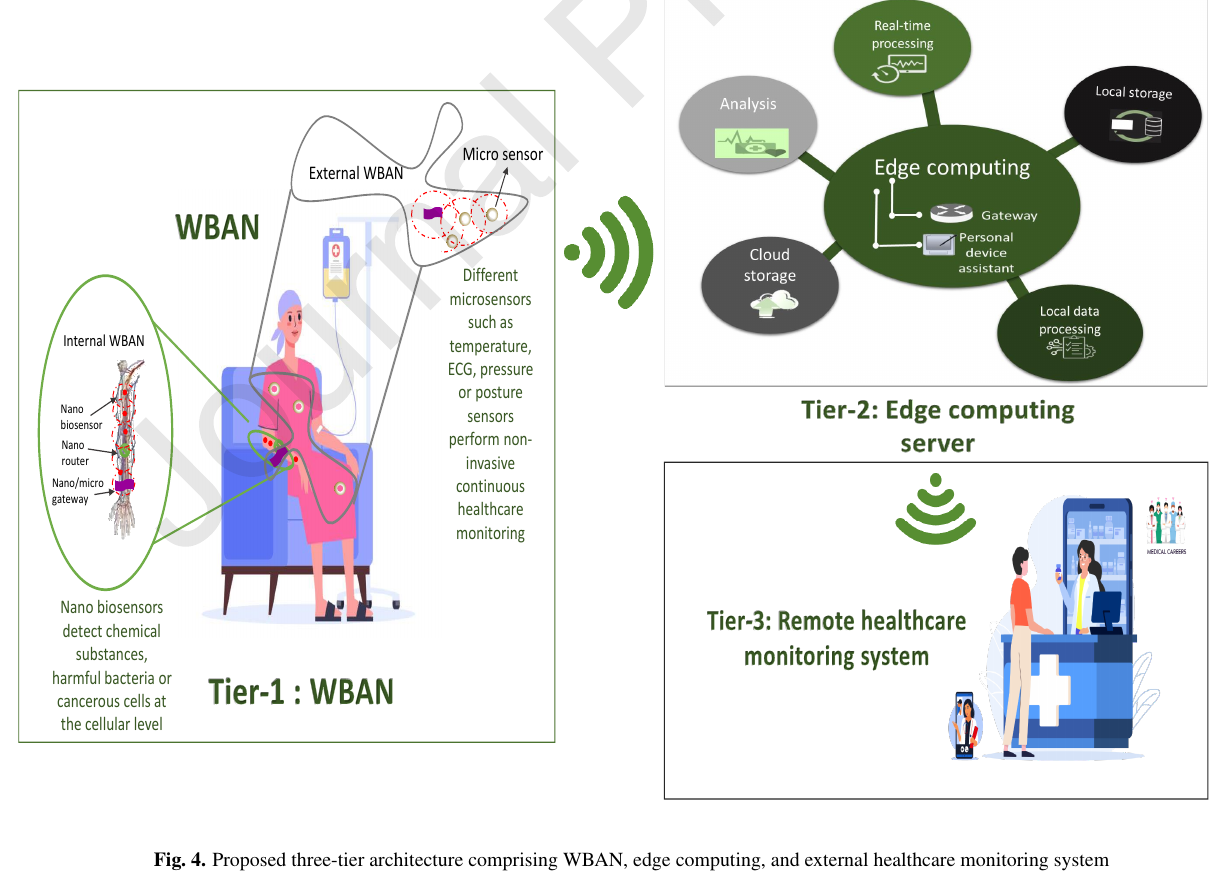
Figure 4 depicts the proposed design architecture. The nano biosensors provide cell-level monitoring, such as monitoring cancerous cells. While nanorouters have more energy and transmission power for collecting monitored information from nano biosensors. Microsensors also have better energy, storage, transmission, and computation power for monitoring parameters such as ECG, temperature, or physiological movements.
• First-tier WBAN: In the proposed architecture, we assume that microsensors and gateways have 2 types of transceivers that enable both nano and micro communications. Therefore, the internal WBAN considered is comprised of nano biosensors and nanorouters. Both biosensors and nanorouters are directly connected to the gateways and microsensors constituting the external WBAN. Internal and external WBANs work together to provide a broader level of healthcare monitoring. The nanoscale communications among nanosensors, nanorouters, and gateways is achieved with electromagnetic waves in the THz band using graphene-based nanoantennas. Micro communications could be performed using IEEE 802.16.5 standard.
• Second-tier: In the second tier, microsensors and gateways are connected to PDAs running edge computing services for local data processing before sending it to cloud servers. Microsensors are connected to PDAs via the Internet or WiFi technology.
• Third-tier: This layer includes remote cloud servers, where all data is filtered and analyzed and the results obtained are stored for use in future medical decisions.
 https://doi.org/10.1016/j.dcan.2024.11.012 https://doi.org/10.1016/j.dcan.2024.11.012
However, to reap the full benefits of WBAN technologies, a thorough understanding of the types of WBANs (i.e., internal or external WBANs), its components and constraints (e.g., types of sensing devices, available energy, storage, and computational power) are essential because these factors play a vital role in WBANs. Understanding the difference between internal (i.e., usually consisting of implanted sensing devices) and external WBANs (i.e., sensors placed around the human body) helps in selecting the appropriate technology for specific healthcare needs and aids in the design of devices for invasive procedures or non-invasive monitoring. This understanding also safeguards the patient's well-being by enabling healthcare practitioners to assess device invasiveness and potential risks accurately. Moreover, understanding the internal/external WBAN distinction is crucial for addressing data privacy, security concerns, and ethical considerations inherent to implantable technologies. A strong understanding of the components and constraints of WBANs can ensure long-term uninterrupted monitoring because continuous monitoring and reporting of body conditions considerably consume the battery power of sensing devices, and it is unfeasible to change the sensing devices frequently. Thus, we need to manage the energy resources of sensing devices efficiently to avoid unnecessary energy usage during the execution of these routine tasks. Energy-efficient WBANs have been an ongoing research topic since their emergence, and recent research efforts on WBANs have focused on developing energy management solutions and energy-efficient protocols and algorithms. As a result, numerous energy-efficient schemes [28], [29], [30], [31], [32], [33], [34] for WBANs have been proposed to extend the lifetime of WBANs. However, energy efficiency remains a significant challenge because of the increasing operational demands and the limited battery power of sensing devices [35].
 https://doi.org/10.1016/j.dcan.2024.11.012 https://doi.org/10.1016/j.dcan.2024.11.012
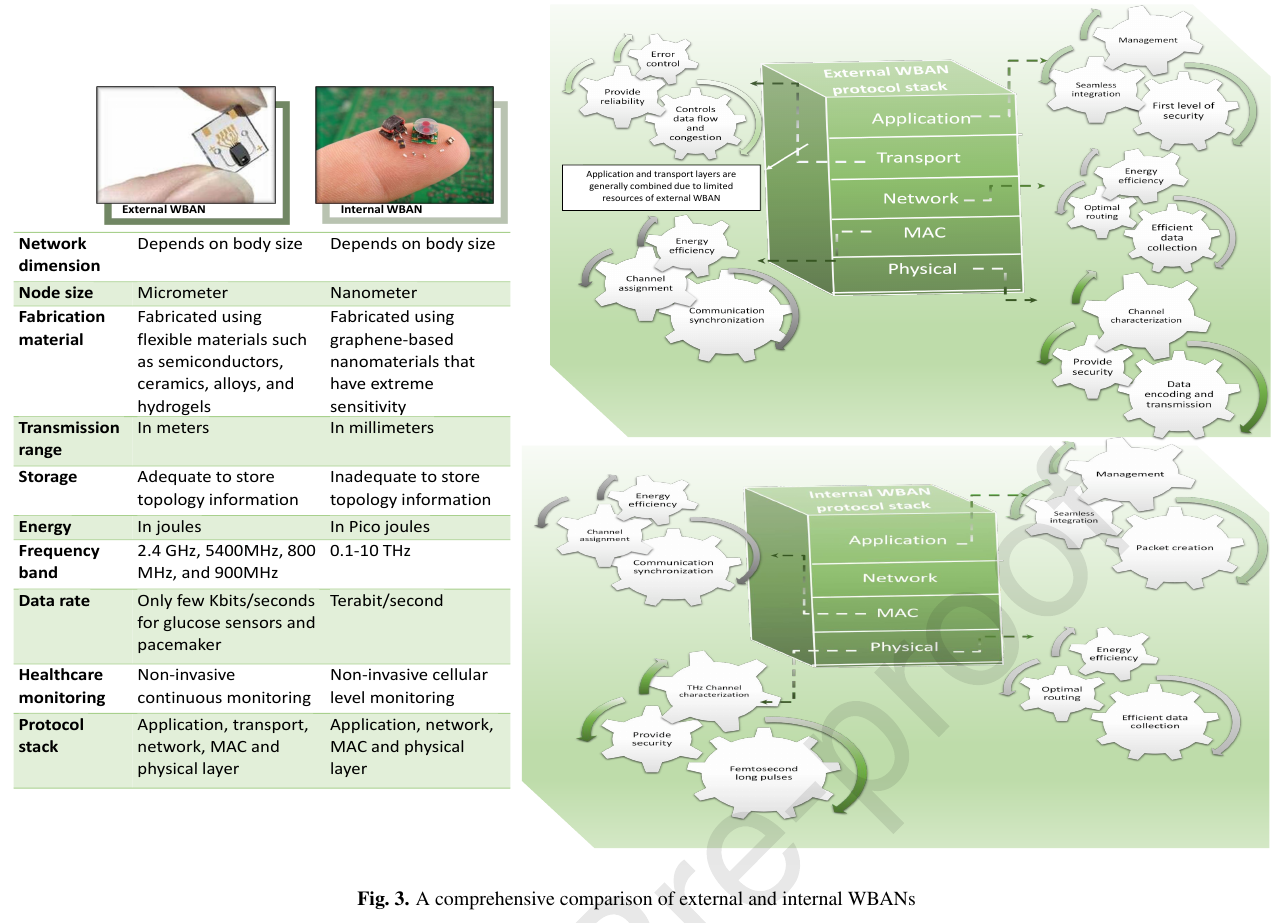
Internal and External WBANS - Communication Architecture
A WBAN can be external or internal WBAN both of which broadly shares the same basic architecture wherein smart watches or mobile devices connect to the external healthcare system using wireless technologies such as Wireless Local Area Networks (WLANs), and cellular networks, Zigbee, or Bluetooth for advanced medical decisions. However, the communication technologies of internal and external WBANs are different because of the different characteristics of their internal and external communication environments [109]. This section describes internal and external WBANs by considering their features, capabilities, communication architectures, and protocols to help in designing energy-efficient schemes for WBANs.
External WBAN: An external WBAN is composed of microsized medical sensors (and gateways) worn by patients to monitor different parameters such as the temperature, posture, ECG, and oxygen saturation from outside the human body [36], [49], [110] for tracking health and fitness states. External WBAN devices include fitness trackers, heart rate monitors, smartwatches, and other wearable electronics that collect physiological data and transmit it to external devices such as smartphones, computers, or servers for healthcare analysis.
The communication architecture of an external WBAN allows these distributed sensing devices to cooperate to achieve a common objective. The transceiver integrated into sensors and gateways allows communications in the license-free Industrial, Scientific, and Medical (ISM) band centered at 2.45 GHz [118]. Data communications in the ISM band allows WBAN devices to use other wireless technologies such as Wi-Fi and Bluetooth. In 2012, the Federal Communications Commission (FCC) allocated 2.36-2.40 GHz for medical device communications in WBANs to mitigate the interference caused by the adjacent devices [119]. In addition, FCC also specified the 2.4-2.5 GHz ISM band for Ultra-WideBand (UWB) to reduce multipath fading [120]. UWB significantly increases the data rate to 500 Mbps.
Furthermore, gateways operating in the ISM band use wireless technologies such as IEEE 802.15.4 and 802.15.6 to reduce costs and power consumption of the WBAN devices. IEEE 802.15.4 operates in the frequency bands of 868 MHz, 915 MHz, and 2.4 GHz as a key standard used in Wireless Sensor Networks (WSNs) [121]. IEEE 802.15.4 supports short-distance (up to 10 meters) communications, low power consumption, reduced costs, and low bit-rate transmission (250 kbits/s) among cheap fixed or mobile sensing devices, as an optimal solution [122].
Internal WBAN: An internal WBAN is composed of biosensors (generally in nano sizes) implanted inside the human body for non-invasive monitoring, diagnosis, and drug delivery [109], [137], [138]. The high precision and accuracy of nano biosensors allow cell-level monitoring, early detection of cancerous cells, and targeted drug delivery [139], [140], [141], [142]. A few examples of internal WBANs include implantable pacemakers, and glucose monitoring sensors for diabetes management. Neurostimulators can provide therapeutic electrical stimuli to the nervous system, and deep brain implants can treat Parkinson's disease, and the essential tremor. This section describes an internal WBAN regarding its components, communication architecture, and protocols.
Components and design: An internal WBAN is composed of nanoscale devices (i.e., biosensors, nanorouters, and nanoactuators) that leverage the special properties of nanoparticles and nanomaterials to detect different types of events [109], [143]. Biosensors are manufactured using graphene-based nanomaterials with unique sensitivities, specificities and electronic properties, allowing non-invasive deployments in the human body to detect harmful bacterial or chemical substances without causing any harm [144], [145], [146]. In addition, biosensors also integrates graphene-based nano transceivers, sensors, memory, power units and processors to enable nanoscale communications. However, biosensors with their inadequate data storage and limited computing capabilities can only perform low-complexity operations such as sensing, transmitting, aggregating, and following commands [147]. In addition, their nanosized power units have very low energy capacity in pico joules, only allows the transmission of a total of 8 data packets of 120 bytes in their complete lifespans [87]. Therefore, energy-efficient and energy harvesting mechanisms are needed for an internal WBAN. Moreover, nano biosensors also have very low storage capacity that cannot store complete routing information. Accordingly, the biosensors located inside the human body are topology-unaware and require support from nanorouters or microsensors with sufficient resources for complex packet processing [137], [148].
Energy consumption contributors in external WBANs
The sensor's circuitry and the algorithms running on it both consume energy to perform their designated operations. We discuss the primary hardware and software components that contribute to energy consumption below.
• Hardware: All the hardware components of a sensing device, such as microcontrollers, radios, and sensing units, require energy to complete their operations. The amount of energy consumed by different components depends on the application requirements and usage.
Microcontrollers: The Analog to Digital Converter (ADC) integrated at the microcontroller of sensing devices consumes a substantial amount of energy to convert an analog signal such as voltage to a digital form so that it can be read and processed. The ADC also needs high-frequency sampling to reduce information loss and achieve high accuracy. However, when the sampling frequency is higher, it also leads to higher energy consumption as it requires processing a greater number of samples per second from a continuous signal to produce a discrete or digital signal. Moreover, digital signal processors perform various mathematical operations on the digitalized signal to execute quick mathematical functions such as addition, subtraction, multiplication, and division, increasing energy consumption.
Radios: Sensing devices use radio transmitters (i.e., an electronic circuit) that transform electric power from a power source (such as a battery or mains power) into a radio frequency alternating current. When the current is applied to the antenna, it radiates the energy as radio waves for information transmission. In contrast, the radio receiver is simply an electronic device that receives and converts radio waves into a usable form. Sensing devices consume a large part of available energy during idle listening as data is sent infrequently. To prevent energy dissipation during idle listening, duty cycling has been proposed [124], [125]. Moreover, data compression and filtering operations also cause high energy dissipation during data transmission (the range of one nanojoule/bit for traditional transceivers) [112].
Sensing Unit: Sensing devices need energy resources to measure physical parameters such as the temperature, pressure, heartbeat, or motion. For example, an ECG sensor consumes 61.1 μWatt during heartbeat detection [126]. The temperature sensors introduced in [127] consume only 0.9 μWatt. While a pressure sensor for wearable monitoring consumes μWatt [128].
•Software: Various algorithms running at different layers such as application, transport, network, MAC, and physical layers need adequate energy resources for efficient communications and data processing. The physical, MAC, and routing layer protocols are considered the leading contributor to energy consumptions as wireless communications causes maximum power overheads.
Data communication algorithms: Various lower-layer (i.e., MAC and routing layers) algorithms support efficient data consumptions by running different algorithms such as overhearing, idle listening, and path selecting that rapidly deplete energy resources due to excessive packet forwarding and frequent packets retransmissions [40]. Therefore, energy-efficient mechanisms [56], [129], [130], [131], [132] have been investigated at the MAC and routing layers for optimal energy usage. The next subsection provides detailed discussions of state-of-the-art methods for addressing energy-related constraints. At the same time, LPWAN technologies [121] have also been used to enable low-power wireless communications in a WBAN environment [80].
Data compression, security, and Quality of Service (QoS) provisioning algorithms: Data compression, security, and QoS provisioning algorithms running at the application and transport layers to enable secure, reliable, and low-latency real-time communications are also computationally intensive to increase energy consumption and transmission overheads. For example, efficient packet recovery and congestion control algorithms use packet retransmission and acknowledgment mechanisms to increase data reliability and thereby cause an increase in power consumption [133]. Similarly, data compression, security, and privacy algorithms also need to perform computation-intensive operations such as compressing redundant data and using encryption, decryption, and authentication schemes to secure patient data [134], [135]. The secure key exchange for authentication can provide access to the patient's data, also leading to high energy consumption [136].
 https://doi.org/10.1038/s41598-024-55662-w https://doi.org/10.1038/s41598-024-55662-w

BIO-CYBER INTERFACE Version 3.1 - Mini version.
Click on square 3 to view the full version.
| 1. Nano Dust Dispersal |
2. Human Breathes in Nano Dust |
3. Nano Dust in Body |
4. EMF Scans for & Detects Nano Dust in Bodies |
 |
 |
 |
|
| 5. Biological + Digital = |
6. A Bio-Cyber Interface is Formed |
7. Central AI Cloud Bio-Data Storage |
8. Mainframe & Gateway Network |
 |
 |

|
The sum of all real-time bio-data and 'energy harvesting' surveillance is archived and processed in the "AI central mainframe". Also called a "cloud". This central mainframe can be accessed from any decentralized location. Medical, government, and military echelons (technocrats) would be granted 'administrative access' to this mainframe. Gateway devices enable the wireless network to telemetrically circulate and transcieve biodata from your body throughout the wireless network spectrum in real-time. In what is called 'distributed tracing architecture' and 'ubiquitous surveillance'. Gateway devices all around you are constantly emitting 'fields' to 'scan and detect' nanoparticles inside your body using your biofield as a conduit to 'actuate' and transceive your biodata back out into the wireless network.
Gateway Devices: Light Fidelity (Li-Fi), Smartphones, Smart devices, Smart appliances, Bluetooth devices, cars, antenna COMMS towers, doppler towers, public places like grocery stores and super markets, airplanes, drones, satellites, etc.. |
| 9. Wireless Internet Healthcare |
10. Bio-Cyber Interface Operating System |
11. Real-time Biosurveillance |
12. Nano Dust |

|
|
|
- Superparamagnetic Iron Oxide Nanoparticles: Magnetic Nanoplatforms as Drug Carriers  (download PDF)- Corona Phase Molecular Recognition (CoPhMoRe)” – This is a dual-use targeting system which enables nanoparticle surfaces to recognize specific analytes or chemicals for purposes of measuring, analyzing, or acting upon them. (download PDF)- Corona Phase Molecular Recognition (CoPhMoRe)” – This is a dual-use targeting system which enables nanoparticle surfaces to recognize specific analytes or chemicals for purposes of measuring, analyzing, or acting upon them.
- Precision Health Intelligence (can)- Drug Delivery System Platforms- Bioimaging Applications
- Cyber-Physiochemical Interfaces"cyber-physiolochemical interface (CPI) that iscapable of extracting biophysical and biochemical signals, and closely relating themto electronic, communication, and computing technology, to provide the core for aforementioned applications." (download PDF) |
| 13. Drug Delivery Systems |
14. Executing Magnetic Signatures |
15. Teslaphoresis + Self Assembly |
16. Targeting |
|

|

|
Not only are Nanoparticles designed to recognize specific analytes or chemicals inside the body, it is also designed to be EMF responsive to "magnetic signatures".
A magnetic signature is equivalent to executing a computer "command line" over the wireless network by a "sender" to a "receiver" (you, node). Sender Node to Receiver Node.
Depending on the design and objective of the nanoparticles. When magnetic signatures reach the nanoparticles it triggers self-assembly and teslaphoresis which influences,alters, and manipulates the organic Molecular Communicative processes in the body.
This is essentially a 'drug delivery platform' that can be used to manipulate and switch off genes and hormones in the body. Altering mood, thoughts, and behaviour. |
| 17. |
18. Nanocarriers |
19. X-Ray from a Distance |
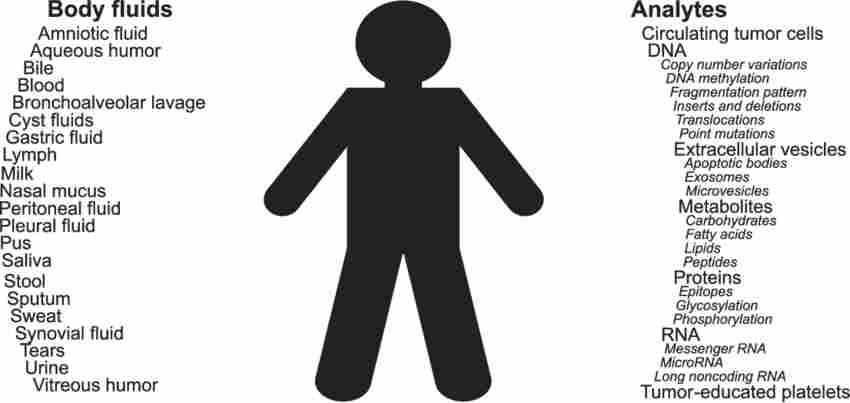
20. Analytes & Body Fluids |
An individual can download special software onto a phone or computer and log into the AI mainframe, and depending on administrative rights, can view and alter physiochemical parameters on the "digital twin" of the target at hand.
All gateway devices around us are constantly emitting frequencies that specifically scan the external magnetic field for nanoparticles, including intra-body nanoparticles. This relays physiochemical data back to the "sender".
|
|
Usually, before an x-ray appointment. The patient is required to drink Barium particles in liquid form so the x-ray machine can scan those particles and convert a visual image of your organs on a live screen.
This is the same concept being used on the macro scale population using nanoparticles and gateway devices with optogenetic capabilities. |
|
TEXT BASED INFORMATION & LINKS
 |
|
Emission from human skin in the sub THz frequency band
Modern health care greatly benefts from non-invasive diagnostic techniques, especially if they are passive. Yet,there are surprisingly few methodologies for this. Beyond visual inspection, some work has been done on thermalimaging1,2, facial recognition3 and even using Doppler Radar4 to monitor heartbeat. However, the avenues forsuch monitoring are restricted by what can be emitted via human skin. Recently, Radiometry experiments onhuman subjects has revealed that in the sub-THz frequency band (480 GHz to 700 GHz) the emitted signal canrefect the level of stress experience by the person5. Tis work suggested the body core temperature as a sourceof blackbody radiation (T=37 °C) that was modulated by its passage through the skin. To understand better thenature of transmission through the skin, one can use a simulation model. In this work, we perform analysis ofelectromagnetic (EM) response of the human skin in the frequency range of 500 GHz up to 700 GHz, by studying the simulated transmission coefcient, S21, in this frequency range. Using this approach, we clarify what partof the blackbody radiation passes the human skin to the outer world and what part of the skin, considered as alayered system with non-fat boundaries, is the dominant component in this mechanism. Te simulation workis based on an EM human skin model that was developed in house6,7. Te new model, optimized for the currentanalysis, contains the two sections of the sweat duct—the upper epidermal coiled outlet duct and the dermalduct outlet, which was previously ignored.
https://www.nature.com/articles/s41598-022-08432-5.pdf
Black-body radiation
Black-body radiation is the thermal electromagnetic radiation within, or surrounding, a body in thermodynamic equilibrium with its environment, emitted by a black body (an idealized opaque, non-reflective body). It has a specific, continuous spectrum of wavelengths, inversely related to intensity, that depend only on the body's temperature, which is assumed, for the sake of calculations and theory, to be uniform and constant.[1][2][3][4]
A perfectly insulated enclosure which is in thermal equilibrium internally contains blackbody radiation, and will emit it through a hole made in its wall, provided the hole is small enough to have a negligible effect upon the equilibrium. The thermal radiation spontaneously emitted by many ordinary objects can be approximated as blackbody radiation.
Of particular importance, although planets and stars (including the Earth and Sun) are neither in thermal equilibrium with their surroundings nor perfect black bodies, blackbody radiation is still a good first approximation for the energy they emit. [5]
The term black body was introduced by Gustav Kirchhoff in 1860.[6] Blackbody radiation is also called thermal radiation, cavity radiation, complete radiation or temperature radiation.
https://en.wikipedia.org/wiki/Black-body_radiation
Helical antenna
A helical antenna is an antenna consisting of one or more conducting wires wound in the form of a helix. A helical antenna made of one helical wire, the most common type, is called monofilar, while antennas with two or four wires in a helix are called bifilar, or quadrifilar, respectively.
In most cases, directional helical antennas are mounted over a ground plane, while omnidirectional designs may not be. The feed line is connected between the bottom of the helix and the ground plane. Helical antennas can operate in one of two principal modes: normal or axial.
In the normal mode or broadside helical antenna, the diameter and the pitch of the aerial are small compared with the wavelength. The antenna acts similarly to an electrically short dipole or monopole, equivalent to a 1/4 wave vertical and the radiation pattern,[citation needed] similar to these antennas is omnidirectional, with maximum radiation at right angles to the helix axis. For monofilar designs the radiation is linearly polarized parallel to the helix axis. These are used for compact antennas for portable hand held as well as mobile vehicle mount two-way radios, and in larger scale for UHF television broadcasting antennas. In bifilar or quadrifilar implementations, broadside circularly polarized radiation can be realized.
In the axial mode or end-fire helical antenna, the diameter and pitch of the helix are comparable to a wavelength. The antenna functions as a directional antenna radiating a beam off the ends of the helix, along the antenna's axis. It radiates circularly polarized radio waves. These are used for satellite communication. Axial mode operation was discovered by physicist John D. Kraus[1]
Human Activity Recognition Based on Point Clouds from Millimeter-Wave Radar
Abstract
Human activity recognition (HAR) technology is related to human safety and convenience, making it crucial for it to infer human activity accurately. Furthermore, it must consume low power at all times when detecting human activity and be inexpensive to operate. For this purpose, a low-power and lightweight design of the HAR system is essential. In this paper, we propose a low-power and lightweight HAR system using point-cloud data collected by radar. The proposed HAR system uses a pillar feature encoder that converts 3D point-cloud data into a 2D image and a classification network based on depth-wise separable convolution for lightweighting. The proposed classification network achieved an accuracy of 95.54%, with 25.77 M multiply–accumulate operations and 22.28 K network parameters implemented in a 32 bit floating-point format. This network achieved 94.79% accuracy with 4 bit quantization, which reduced memory usage to 12.5% compared to existing 32 bit format networks. In addition, we implemented a lightweight HAR system optimized for low-power design on a heterogeneous computing platform, a Zynq UltraScale+ ZCU104 device, through hardware–software implementation. It took 2.43 ms of execution time to perform one frame of HAR on the device and the system consumed 3.479 W of power when running.
1. Introduction
The increasing number of single-person and elderly households has drawn attention to the necessity for continuous monitoring to enable the prevention of and fast response to accidents at home. In the event of an accident, individuals often struggle to receive immediate assistance from those nearby; therefore, human activity recognition (HAR) systems should be deployed to accurately infer human activity in case of emergency. In addition, the power consumption for detecting human activity must be low at all times, and the cost of operating the HAR system must be low in order for it to be available for as many people as possible. Therefore, it is essential to research low-power and lightweight HAR systems that achieve high accuracy in human activity inference. In response to this need, HAR systems using wearable sensors with built-in accelerometers and gyroscopes for indoor accident detection [1,2,3], and sensors that observe the surrounding environment, such as cameras [4,5,6], light detection and ranging (LiDAR) [7], ultrasonic sensors [8,9], and radar [10,11,12,13,14,15], have been actively researched.A limitation of wearable sensors is that the device must be worn continuously to infer human activity [16]. Ultrasonic sensors have a narrow sensing range, and their performance varies significantly depending on the material or shape of the object being detected [17]. Camera-based sensors can cause portrait-rights infringement when collecting image data [17]. LiDAR has the disadvantages of high cost, narrow detection range, and sensors that are highly affected by the surrounding environment [17]. In comparison, radar has the advantages of having a lower cost than LiDAR and a wider range of detection and is less affected by the surrounding environment [16,17].Several types of data can be collected using radar; however, two main types of data can be used when performing HAR based on radar sensors—range-Doppler map and point clouds. Point-cloud data have a sufficiently high resolution to distinguish the shape of objects, and a higher inference accuracy can be achieved while maintaining a level of network complexity similar to that when using range-Doppler maps as input data [18].Singh et al. [11] constructed an HAR system using point-cloud data collected by millimeter-wave radar. They collected an MMActivity dataset consisting of five classes and used a model consisting of a time-distributed, convolutional neural network (CNN) and a bi-directional long short-term memory (LSTM).
The classification network of this HAR system achieved 90.47% accuracy using 291 K parameters. Kim et al. [12] conducted human motion classification using a point-cloud dataset consisting of seven classes, which they collected themselves. The authors used a model consisting of 2D-DCNN and DRNN, and they achieved 96% accuracy with 1510 K parameters using 2D-DCNN alone, and 98% accuracy using a combination of 2D-DCNN and DRNN. Huang et al. [13] constructed an HAR system using their own point-cloud dataset and a range-Doppler dataset consisting of six classes. The point-cloud data pass through a 3D CNN and LSTM, and the range-Doppler data pass through a 3D CNN. The two types of data are concatenated to classify human activity. An accuracy of 97% was achieved using a fusion network that placed two networks in parallel. Ding et al. [14] used six classes of point-cloud data collected by themselves to classify human activity. The method using time-Doppler (TD) achieved 95% accuracy in combination with 3D-PointNet using 1610 K parameters, and the method using range-Doppler (RD) achieved 98% accuracy in combination with 4D-PointNet. Gu et al. [15] augmented five classes of self-collected point-cloud data with segment-wise point-cloud augmentation (SPCA) to organize a dataset and infer human activity. In this study, Lite-PointNet and a bidirectional lightweight LSTM (BiLiLSTM) were used to achieve 95% accuracy. Lite-PointNet achieved high accuracy with a lightweight network using 79.7 K parameters, and the HAR system was ported to Raspberry Pi to implement the edge device.To effectively utilize HAR technology in indoor environments, edge devices capable of performing HAR must be deployed to infer the activity of people, wherever they are. Multiple edge devices are required to build such an environment, whose cost is closely related to the cost of the edge devices. To reduce the cost of edge devices, a lightweight HAR system aimed at low memory usage is essential, and a low-power design should be used to reduce maintenance costs. Although high HAR accuracy is important, it is also important to design an appropriate HAR model that considers network complexity and therefore memory usage.In this study, a pillar feature encoder (PFE) was used as an encoder for 3D point-cloud data for the purpose of lightweighting the network [19]. The PFE clusters 3D point clouds and converts them into 2D images. The advantage of using PFE is that 2D convolution can be applied on 2D images instead of 3D images in the classification network, thereby reducing the network complexity. The classification network was optimized based on depth-wise separable convolution and has the advantage of low complexity. Depth-wise separable convolution consists of depth-wise convolution and point-wise convolution, in which fewer parameters are required for the operation compared to a general convolution [20].Existing radar point-cloud HAR studies have achieved high accuracy but are limited by the lack of discussion on lightweight HAR systems and low-power designs. Considering the practicality of HAR technology, it is crucial to develop a lightweight HAR system that operates efficiently at low power on edge devices. Therefore, in this study we used Xilinx’s FINN [21] to design a hardware–software implementation of an HAR system on an edge device, aiming to achieve a low-power, lightweight solution while maintaining an inference accuracy comparable to existing studies.The remainder of this paper is organized as follows: In Section 2, we introduce the dataset collection. In Section 3, we describe the structure of the proposed HAR system in relation to data pre-processing, the encoding of point-cloud data, and a classification network. In Section 4, we evaluate the performance of the hardware–software implementation of the HAR system using FINN. Finally, in Section 5, we conclude the study.2. Data Collection Using Frequency Modulated Continuous Wave (FMCW) RadarThe dataset used in this study was collected using the RETINA-4SN radar (Smart Radar System, Gyeonggi, Republic of Korea) of the Smart Radar system [22]. The RETINA-4SN radar is an FMCW and multi-input–multi-output (MIMO) millimeter-wave radar that can obtain (𝑥,𝑦,𝑧) coordinates and p (power) for each point in a point cloud at a rate of 20 frames per second. The detailed specifications of the radar are listed in Table 1.
Table 1. Radar specifications.
The data collection process was carried out as shown in Figure 1, where the radar was positioned 0.8 m above ground. Data were collected by having a person perform the actions of each class in the center of a 5 m long and 4 m wide area. A total of three volunteers (subjects), two men and one woman, participated in the experiment. Their heights ranged from 163 to 180 cm, and their weights ranged from 58 to 80 kg. The collected dataset was organized into 11 classes based on activities that often occur in daily life. An example of point-cloud data for each class is shown in Figure 2. Frames with fewer than 10 points included in one frame were excluded from the dataset. Table 2 shows details of the dataset, where each class consists of approximately 1000 to 1100 frames, the maximum number of points in a frame is 1280, and there is an average of 343 points per frame across all classes.Applsci 14 10764 g001Figure 1. Data collection setup.Applsci 14 10764 g002Figure 2. Configuration of dataset classes and their corresponding point clouds: (a) Stretching; (b) Standing; (c) Taking medicine; (d) Squatting; (e) Sitting chair; (f) Reading news; (g) Sitting floor; (h) Picking; (i) Crawl; (j) Lying wave hands; (k) Lying.Table 2. Eleven classes of activity type in the dataset.
3. Proposed HAR System
To design a low-power and lightweight HAR system, first, we designed the HAR system with a 32 bit floating-point format in a GPU environment. Subsequently, the classification network was quantized to a 4 bit fixed-point format for lightweight, and the memory usage was reduced to 12.5% of the original 32 bit floating-point format network. Finally, for a low-power design, the HAR system was hardware–software designed on a heterogeneous computing platform, ZCU104 [23]. Figure 3 shows an overview of the proposed HAR system. The point-cloud data obtained by the radar are input into the microprocessor, and pre-processing is performed on the input point-cloud data. The pre-processed point-cloud data are input to the PFE and converted into a 2D pseudo image by grouping 3D point-cloud data, creating handcraft features and scattering. The converted 2D image is input to the classification network IP implemented on a field-programmable gate array (FPGA), and the activity class is inferred and output through deep-learning operations based on depth-wise separable convolution.Applsci 14 10764 g003
Figure 3. Overview of the proposed HAR system.
3.1. Data Pre-ProcessingThe data pre-processing performed in the microprocessor included both parallel translation and normalization processes. Normalizing point-cloud data ensures that all points are distributed within a certain range without information loss [24]. This facilitates gradient descent learning and prevents bias toward specific values. In addition, by performing a parallel translation before normalization—to move the center of the point cloud to the origin—the point cloud was evenly distributed around the origin when normalization was performed.In this study, parallel translation was performed to move the center of the maximum and minimum values along the (𝑥,𝑦,𝑧) axis to the origin for the points included in each frame. Subsequently, data pre-processing was performed to normalize the (𝑥,𝑦,𝑧) coordinates of all points by dividing the (𝑥,𝑦,𝑧) coordinates of all points by the largest absolute value.
3.2. Pillar Feature EncoderThere are several methods to encode point-cloud data. The voxel feature encoding (VFE) layer of VoxelNet [25] uses voxels to encode in three dimensions; this has the disadvantage of increasing the network complexity using 3D convolution. In addition, the multi-view (MV)CNN [26] uses as its input the 2D images that are projected from multiple directions of 3D point-cloud data; this has the disadvantage of overlapping points occurring during the process of projecting points, resulting in information loss. However, the PFE uses pillars to convert 3D point-cloud data into 2D pseudo images to enable image-based inference. Therefore, the PFE can be used to convert 3D point-cloud data into 2D images without loss of information, and as it outputs a 2D image it has the advantage of lowering the complexity of the network by utilizing 2D convolutions instead of 3D convolutions in the classifier.The PFE consists of three major steps: grouping, handcraft feature extraction, and scattering. Grouping is the process of grouping points into pillars with an infinitely extended z-axis. The xy plane was divided into uniformly spaced regions, and each region was treated as a pillar. Points within a uniform area were grouped into the internal set of pillars of the region; if no points were inside a pillar, the pillar was excluded from the grouping. Finally, the remaining pillar contained the pillar index, which indicated its position on the xy plane, the number of points inside the pillar, and the (𝑥,𝑦,𝑧,𝑝) channel information of the internal point. In the handcraft feature extraction process, the point data consisting of (𝑥,𝑦,𝑧,𝑝) 4 channels were expanded to a total of (𝑥,𝑦,𝑧,𝑝,𝑥𝑐,𝑦𝑐,𝑧𝑐,𝑥𝑝,𝑦𝑝) 9 channels by adding the center point coordinates (𝑥𝑐,𝑦𝑐,𝑧𝑐) of the points inside the pillar and the center coordinates (𝑥𝑝,𝑦𝑝) of the pillar. Subsequently, the point data of the 9 channels were expanded to 64 channels by passing them through point-wise convolution, batch normalization, and the ReLU activation function. In the scattering process, the pillar index information saved in the grouping process was used to place each pillar and the point data of the 64 channels within the pillar at the existing location on the xy plane.
3.3. Classification NetworkIn this study, we optimized and used a depth-wise separable convolution-based network from various existing image inference networks. A depth-wise separable convolution consists of point-wise convolution and depth-wise convolution. Point-wise convolution adjusts the number of output channels using a 1×1 filter, whereas depth-wise convolution is a convolution in which one filter is applied to only one channel. When the input has M channels, depth-wise convolution requires only M filters; therefore, the network can be constructed using fewer filters, or in other words, fewer parameters, compared to general convolution.4. Results4.1. ExperimentIn this paper, we compared the performance of the different network configurations in Table 3 by setting the following as parameters: the 2D pseudo image size encoded in PFE, the number of depth-wise separable convolution layers (#ds-conv.), and the channel configuration of the network. Table 4 lists the numbers of output channels per convolution layer for each network (A, B, C, D, E). The Network A configuration has 64 output channels for all depth-wise separable convolution layers, and Network B has 128 output channels for the last depth-wise separable convolution layer. Network C has the last two depth-wise separable convolution layers, each with 128 output channels. Network D has the last depth-wise separable convolution layer with 256 output channels and the previous layer with 128 output channels. Finally, Network E has 256 output channels in the last depth-wise separable convolutional layer and 128 output channels in each of the two previous layers. In this way, a total of 42 networks were configured, and an NVIDIA RTX A6000 GPU [27] (NVIDIA, Santa Clara, CA, USA) was used for network training and verification. In addition, all the networks used the same training settings (300 epochs, learning rate of 0.001, batch size of 24, Adam optimizer, and negative log likelihood loss (NLL loss)). For training and verification, we used a dataset of 11,769 frames collected by ourselves, which were divided into training data of 10,594 frames and test data of 1175 frames. In addition, to investigate the generality of the proposed HAR system, we performed stratified 10-fold cross validation. “Accuracy” was calculated to evaluate the classification performance in terms of true positives (TPs), true negatives (TNs), false positive (FP), and false negatives (FNs).𝐀𝐜𝐜𝐮𝐫𝐚𝐜𝐲=𝑇𝑃+𝑇𝑁𝑇𝑃+𝐹𝑁+𝐹𝑃+𝑇𝑁(1)Table 3. Accuracy of models by various parameters and networks.
Table 4. Output channel configuration for network (A,B,C,D,E).
Finally, the model with the smallest number of network parameters (64 × 64 image size, 3 depth-wise separable convolutions, and B network configuration) was selected as the final image classification network among those models with an HAR accuracy of 95% or higher (Table 3) to configure the HAR system.The backbone network structure of the proposed HAR system is shown in Figure 4. When a 2D image of size 64 × 64 with 64 channels was input, it was converted to an 8 × 8 image with 128 channels using three depth-wise separable convolution layers. It was then passed through max pooling and the fully connected layer to classify the 11 classes of human activity.Applsci 14 10764 g004Figure 4.
Proposed classification network.
We compared the performance of the optimized depth-wise separable convolution-based network with the existing, representative, image classification networks LeNet5 [28], VGGNet [29], ResNet [30], and MobileNet [31] as the backbone network of the HAR system. Table 5 shows the results of comparing the classification accuracy and network complexity between the networks, confirming that the network proposed in this study is superior in terms of accuracy, number of multiply–accumulate (MAC) operations, and number of network parameters.Table 5. Comparison between image classification networks.
4.2. Evaluation and AnalysisThe loss curve and accuracy curve for training and testing after 300 epochs of training are shown in Figure 5, where NLL loss is used as the loss function. The loss decreased significantly in the early epochs of training and tended to decrease moderately after approximately 50 epochs. Similarly, the accuracy increased significantly in the early epochs of training and tended to increase and maintain a moderate rate after approximately 50 epochs.Applsci 14 10764 g005Figure 5. Training and test loss curve and accuracy curve: (a) Training and test loss curve; (b) Training and test accuracy curve.The confusion matrix for the HAR system using our dataset is shown in Figure 6. The sitting floor class tended to be confused with the lying, lying wave hands, and sitting chair classes. This is because the sitting floor class is similar to the sitting chair class in terms of sitting motion and is similar to the lying class in terms of being close to the ground.Applsci 14 10764 g006Figure 6. Confusion matrix.
4.3. Performance Comparison by Quantization Bit FormatsA lightweight model design and a low-power design are essential for the practical use of HAR systems. For this purpose, the proposed HAR system was implemented on the Xilinx Zynq UltraScale+ ZCU104 (Xilinx, Santa Clara, CA, USA) for a low-power design. To implement a classification network on the FPGA part of the ZCU104 platform, a register transfer level (RTL) design is required, which includes the process of converting the system implemented in a floating-point format to a fixed-point format. In RTL design, the more bits that express a number, the larger the range of numbers that can be expressed; this improves accuracy but requires a large memory for system storage and operation. To find a tradeoff between accuracy and memory usage, we compared the HAR accuracy based on the bit formats of the classification network, as shown in Table 6. The Brevitas library provided by Xilinx was used to quantize the input data, weight, bias, and activation functions [32]. As shown in Table 6, the accuracy decreased by less than 1% from 32 bits to 4 bits; however, at 2 bits the accuracy degradation was approximately 13% compared with other bit formats. Therefore, 4 bit quantization was selected as the best tradeoff between accuracy and memory usage for the classification network and was implemented on the FPGA.Table 6. Comparison of the classification network accuracy by bit format.
4.4. Hardware–Software ImplementationFINN is a deep-learning framework developed by the Integrated Communications and AI Lab of AMD Research & Advanced Development. Using FINN, we optimized a classification network configuration based on the Xilinx library and generated the RTL code and IP of the optimized network. Our implementation of the HAR hardware–software performs data pre-processing and PFE on a microprocessor and deploys a classification network IP created using FINN on an FPGA. Figure 7 shows the environment in which the classification network was implemented on an FPGA using FINN, and where the HAR system was validated with a hardware–software implementation.Applsci 14 10764 g007Figure 7. Environment used for FPGA implementation and verification.The specifications of the HAR system with the hardware–software implementation is shown in Table 7. The platform used was an Xilinx Zynq UltraScale+ ZCU104 with an ARM Cortex A53 processor (ARM, Cambridge, England, UK) operating at 1.2 GHz, and the execution time of the HAR system in this environment was 2.43 ms. The proposed HAR system utilized 29,720 configurable logic block (CLB) look-up tables (LUTs), 22,893 CLB registers, 72 digital signal processors (DSPs), and 25.5 block RAMs. The maximum operating frequency was 300 MHz, and the power consumption was 3.479 W, making it a lightweight HAR system that runs at low power on edge devices.Table 7. Specifications of the HAR system implementation on the Zynq UltraScale+ ZCU104.
4.5. Performance ComparisonTable 8 shows the results of the performance comparison of the HAR system proposed in this paper with those of other radar point-cloud-based HAR systems. The comparison was conducted based on the input feature size of the classification network, number of data classes, accuracy, number of network parameters, the device that implemented the system, and the power consumption. The proposed HAR system distinguished 11 classes, the most, and achieved 94.79% accuracy by performing 4 bit quantization. It also used 22.28 K parameters in the network, the smallest number of parameters. In terms of power consumption, the RTX3080 consumed 320 W, the RTX2060 consumed 175 W, and the Raspberry Pi consumed 3.6 W. However, the proposed HAR system using the ZCU104 platform consumed 3.479 W of power, which is up to 92 times less than using RTX3080. Compared to other HAR systems, the proposed HAR system achieved the lowest power consumption, indicating that we have achieved a low-power design.Table 8. Performance of the reference HAR system versus the proposed HAR system.
5. ConclusionsIn this study, we proposed a low-power and lightweight HAR system using radar point-cloud data. The proposed HAR system consists of pre-processing 3D point data with four channels and then inputting the converted 2D image through a PFE to the image classification network. For the HAR technology to be practical, a lightweight and low-power design must be used. In this paper, PFE is used as an encoder for point-cloud data, and an image classification network based on depth-wise separable convolution is used to realize a lightweight HAR system. Also, the 4 bit quantized classification network was implemented on an FPGA to achieve a low-power design. The 32 bit format classification network was quantized to a 4 bit one, resulting in a lightweight design that used 12.5% of the memory of the original 32 bit format network. As a result of the implementation, in terms of network complexity, 25.77 M MAC operations were performed and 22.28 K parameters were used, which is the smallest among the compared HAR systems. An accuracy of 95.54% was achieved with a 32 bit floating-point data format in a GPU environment and 94.79% with a 4 bit fixed-point data format in a hardware–software implementation environment for 11 classes of datasets collected using the FMCW MIMO millimeter-wave radar. In terms of power consumption, the proposed HAR system consumed 3.479 W, which is the lowest power consumption compared to other HAR systems. The results show that the proposed HAR system has a level of accuracy similar to other HAR systems, has relatively low complexity, and can operate at low power. In future work, we plan to implement a low-power, lightweight HAR system on a very-large-scale integrated circuit (VLSI) to achieve a better low-power, lightweight design while maintaining current accuracy.
https://www.mdpi.com/2076-3417/14/22/10764
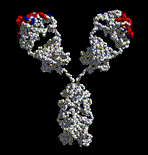
Electrophoresis is a laboratory technique used to separate DNA, RNA or protein molecules based on their size and electrical charge. An electric current is used to move the molecules through a gel or other matrix.
Wireless Sensor Network
Wireless sensor networks (WSNs) refer to networks of spatially dispersed and dedicated sensors that monitor and record the physical conditions of the environment and forward the collected data to a central location. WSNs can measure environmental conditions such as temperature, sound, pollution levels, humidity and wind.[1]
These are similar to wireless ad hoc networks in the sense that they rely on wireless connectivity and spontaneous formation of networks so that sensor data can be transported wirelessly. WSNs monitor physical conditions, such as temperature, sound, and pressure. Modern networks are bi-directional, both collecting data[2] and enabling control of sensor activity.[3] The development of these networks was motivated by military applications such as battlefield surveillance.[4] Such networks are used in industrial and consumer applications, such as industrial process monitoring and control and machine health monitoring and agriculture.[5]
A WSN is built of "nodes" – from a few to hundreds or thousands, where each node is connected to other sensors. Each such node typically has several parts: a radio transceiver with an internal antenna or connection to an external antenna, a microcontroller, an electronic circuit for interfacing with the sensors and an energy source, usually a battery or an embedded form of energy harvesting. A sensor node might vary in size from a shoebox to (theoretically) a grain of dust, although microscopic dimensions have yet to be realized. Sensor node cost is similarly variable, ranging from a few to hundreds of dollars, depending on node sophistication. Size and cost constraints constrain resources such as energy, memory, computational speed and communications bandwidth. The topology of a WSN can vary from a simple star network to an advanced multi-hop wireless mesh network. Propagation can employ routing or flooding.[6][7]
In computer science and telecommunications, wireless sensor networks are an active research area supporting many workshops and conferences, including International Workshop on Embedded Networked Sensors (EmNetS), IPSN, SenSys, MobiCom and EWSN. As of 2010, wireless sensor networks had deployed approximately 120 million remote units worldwide.[8]
UWB-gestures, a public dataset of dynamic hand gestures acquired using impulse radar sensors
Abstract
In the past few decades, deep learning algorithms have become more prevalent for signal detection and classification. To design machine learning algorithms, however, an adequate dataset is required. Motivated by the existence of several open-source camera-based hand gesture datasets, this descriptor presents UWB-Gestures, the first public dataset of twelve dynamic hand gestures acquired with ultra-wideband (UWB) impulse radars. The dataset contains a total of 9,600 samples gathered from eight different human volunteers. UWB-Gestures eliminates the need to employ UWB radar hardware to train and test the algorithm. Additionally, the dataset can provide a competitive environment for the research community to compare the accuracy of different hand gesture recognition (HGR) algorithms, enabling the provision of reproducible research results in the field of HGR through UWB radars. Three radars were placed at three different locations to acquire the data, and the respective data were saved independently for flexibility.
Background & SummaryHand gesture recognition (HGR) provides a convenient and natural method of human-computer interaction. User-friendly interfaces for human-machine interactions can be built using hand gestures. In HGR, gesture data are first acquired using a suitable sensor, and then patterns within the acquired sensory signals are recognized to identify different hand movements. Several sensors exist for data acquisition, including wearable devices1, cameras2, and radar sensors. Recently, radar has been considered a key enabling technology for HGR due to its many benefits over other sensors; for example, radar is less prone to lightning conditions than camera-based sensors. In addition, radar-based HGR systems do not require wearable devices. Currently, several commercial devices (such as Google Pixel 4 smartphones) are equipped with built-in radar for HGR.
Deep learning algorithms have shown great potential for the recognition and classification of hand gestures. Recent studies demonstrated a high classification accuracy for ultra-wideband (UWB) radar-based hand gesture classification3,4, where several sliding and circular hand motions were classified using deep learning approaches. Similarly, researchers from Google designed and manufactured a miniature radar named Soli solely for hand gesture recognition and sensing using a random forest classifier driven by low-dimensional features5. Recently, Wang et al.6 used the same Soli radar sensor5 to classify eleven different gestures using a convolutional neural network (CNN)-based classifier. Another study7 recognized six different gestures with radar sensors intended for vehicular and infotainment interfaces, and the classification output (class) was fed to an Android system to perform the desired operation based on gestures. Furthermore, a system called Radar Categorization for Input & Interaction (RadarCat)8 was established to provide a set of applications, including gesture recognition-based random forest classifiers. Recently, Park et al.9 focused on providing both radar hardware and a recognition algorithm for hand gestures; six different gestures were classified using long short-term memory (LSTM). The aforementioned studies suggest that machine learning-based solutions will enable radar sensors to have considerable positive impacts on HGR. However, machine learning algorithms are based on learning paradigms and therefore require some overhead, such as sufficient computing power and the need for a sufficiently large dataset to train the algorithm. Without an adequate hardware assembly and acquisition environment, it is often not possible to develop and test deep learning frameworks. Thus, to build HGR algorithms without purchasing hardware, a public dataset of hand gestures acquired through radar sensors is needed.
Several (signal and image) datasets for training deep learning algorithms are available to the public for download. For instance, ImageNet10 and LabelMe11 provide large collections of images intended for use in visual object recognition. These datasets eliminate the need to acquire images to test different machine learning algorithms and simultaneously provide a competitive platform for comparing the performance of different algorithms in similar environments. Recently, a small collection of governmental response events for COVID-1912 was released, and over 13,000 policy announcements were made by the governments of 195 countries; this public dataset can be used to train a CNN for the detection of COVID-19. Similarly, PhysioBank13 presents a collection of over 75 datasets containing samples of different biomedical signals, such as cardiopulmonary and neural signals, from both patients and healthy individuals. However, few vision-based hand-gesture datasets exist; among them are the Cambridge Hand Gesture Database (released in 2009) containing nine hundred sequences of images for nine different hand gesture classes14, MSRGesture3D (released in 2012)15 and EgoGesture16 (released in 2018). Furthermore, the RGBD-HuDaAct17 dataset provides a human activity recognition dataset acquired with a video camera and a depth sensor. Pisharady and Serbeck18 reported a comprehensive review of all available vision-based hand gesture datasets, and recently, a dataset of continuous-wave radar datasets for vital signs and heartbeats with six different human subjects recorded over 223 minutes was released19. However, no such public radar dataset exists for hand gestures. For all the studies regarding HGR with radar and other radio sensors, researchers first collect training data before testing their algorithms.
In this paper, we present the first-ever dataset of hand gestures collected using ultra-wideband (UWB) impulse radar. We expect that this dataset may eliminate the need to acquire data for algorithm testing and will provide a competitive environment for the research community to compare the accuracy of existing and newly proposed algorithms. The overall summary and the scope of this study are presented in Fig. 1. Three different radar sensors operating independently in a monostatic configuration are deployed, and the data from each radar sensor are saved separately in the repository. Consequently, the evaluation of HGR algorithms can be performed either by using a single radar sensor or by exploiting signals from multiple radar sensors simultaneously. An application example of a CNN-based classifier, as explained in Fig. 1, is also demonstrated in a subsequent section.
https://www.nature.com/articles/s41597-021-00876-0
|
|