Hemisphere radius = 14.2
Nanosphere radius = 7.1
The center of the nanosphere is 6.4 above the planar surface. The planar surface is normal to the [111] crystal axis.
(cc3bdmp3.cpp 40m.gif)
| Click to see animation. |
| Molecular dynamics simulations are performed for elastic objects with the anisotropic elasticity of crystalline silicon. Simulations of a sphere fixed on a planar substrate allow vibrational frequencies to be found. Broadening of some of the vibrational modes is minimal even when the sphere is quite strongly coupled to the substrate. |
| | |
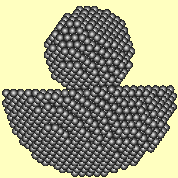
| Figure 1. 7468
"atoms" are used to construct a model of a silicon nanosphere on a
hemispherical silicon substrate. Hemisphere radius = 14.2 Nanosphere radius = 7.1 The center of the nanosphere is 6.4 above the planar surface. The planar surface is normal to the [111] crystal axis. (cc3bdmp3.cpp 40m.gif)
|
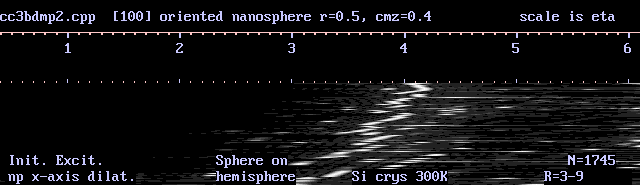
| Figure 2. (C++ computer program used: cc3bdmp2.cpp) | |||||||||||||||||||||||||||||||||||||||||||||||||||||||||||||||||||||||||||||||||||||||||||||||||||
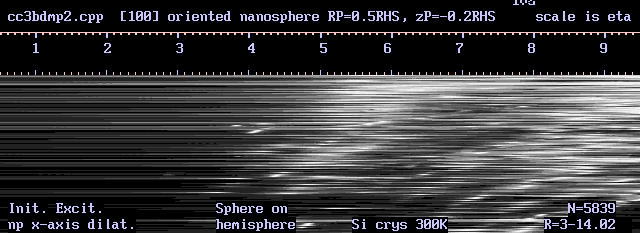
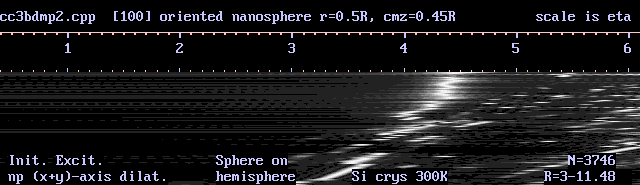
| (a) Rp = 0.5 RHS zpc = 0.4 RHS (cc3bdmp2.cpp 40a.gif) |
 |
 | |||||||||||||||||||||||||||||||||||||||||||||||||||||||||||||||||||||||||||||||||||||||||||||||||
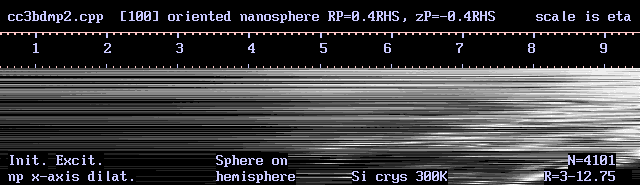
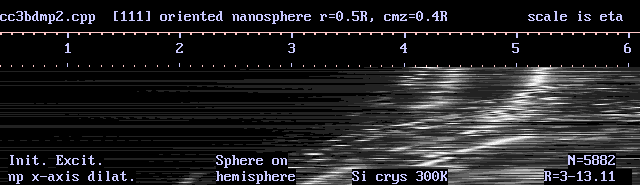
| (b) (cc3bdmp2.cpp 40b.gif) |
 |
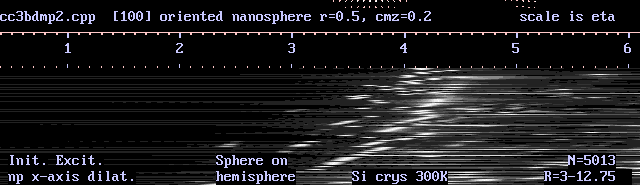 | |||||||||||||||||||||||||||||||||||||||||||||||||||||||||||||||||||||||||||||||||||||||||||||||||
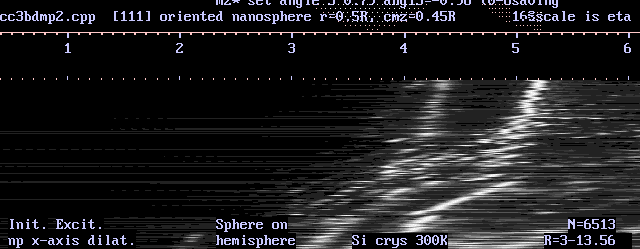
| (c) Note the great broadening which is due to strong damping of the
vibration. (cc3bdmp2.cpp 40c.gif) |
 |
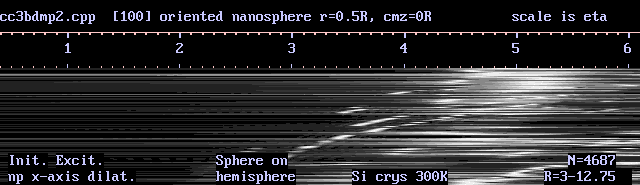 | |||||||||||||||||||||||||||||||||||||||||||||||||||||||||||||||||||||||||||||||||||||||||||||||||
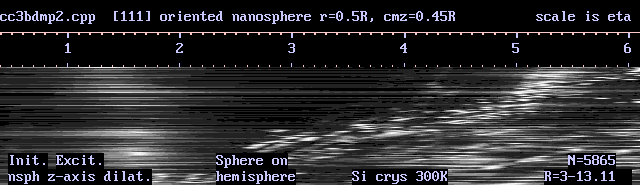
| (d) Even greater damping.
(cc3bdmp2.cpp 40v.gif) |
no diagram available |
 | |||||||||||||||||||||||||||||||||||||||||||||||||||||||||||||||||||||||||||||||||||||||||||||||||
| (e) In this case there is merely a substrate.
(cc3bdmp2.cpp 40w.gif) |
no diagram available |
 | |||||||||||||||||||||||||||||||||||||||||||||||||||||||||||||||||||||||||||||||||||||||||||||||||
| Figure 3. (C++ computer program used: cc3bdmp2.cpp) | |||||||||||||||||||||||||||||||||||||||||||||||||||||||||||||||||||||||||||||||||||||||||||||||||||
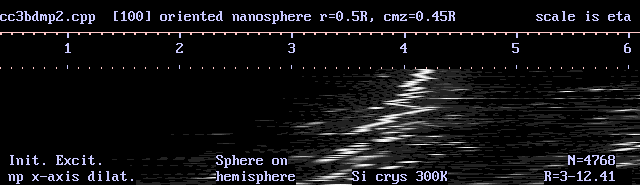
| (a) (cc3bdmp2.cpp 40d.gif)
|
 |
 | |||||||||||||||||||||||||||||||||||||||||||||||||||||||||||||||||||||||||||||||||||||||||||||||||
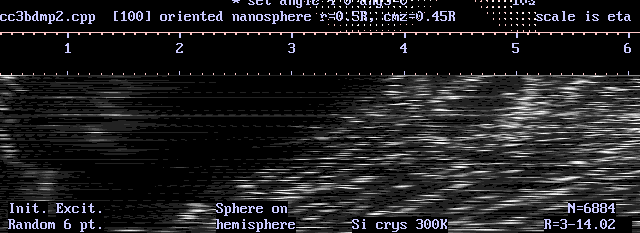
| (b) (cc3bdmp2.cpp 40e.gif) |
|
 | |||||||||||||||||||||||||||||||||||||||||||||||||||||||||||||||||||||||||||||||||||||||||||||||||
| (c) (cc3bdmp2.cpp 40f.gif) |
|
 | |||||||||||||||||||||||||||||||||||||||||||||||||||||||||||||||||||||||||||||||||||||||||||||||||
| (d) (cc3bdmp2.cpp 40h.gif) |
 |
 | |||||||||||||||||||||||||||||||||||||||||||||||||||||||||||||||||||||||||||||||||||||||||||||||||
| (e) (cc3bdmp2.cpp 40i.gif) |
|
 | |||||||||||||||||||||||||||||||||||||||||||||||||||||||||||||||||||||||||||||||||||||||||||||||||
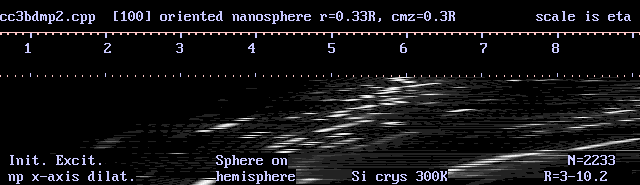
| (f) The initial excitation is a stretching of the nanosphere along the
z-axis. (cc3bdmp2.cpp 40j.gif) |
|
 | |||||||||||||||||||||||||||||||||||||||||||||||||||||||||||||||||||||||||||||||||||||||||||||||||
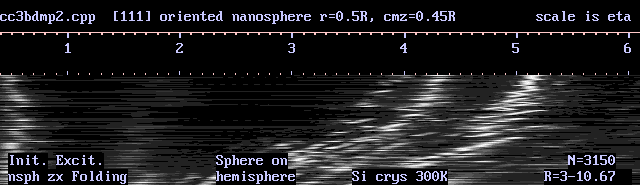
| (g) The initial excitation is side to side waving of the nanosphere.
(cc3bdmp2.cpp 40k.gif)
|
|
 | |||||||||||||||||||||||||||||||||||||||||||||||||||||||||||||||||||||||||||||||||||||||||||||||||
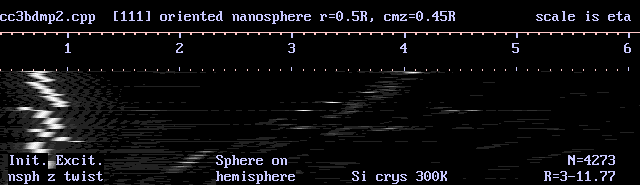
| (h) The initial excitation is a twist of the nanosphere around the
z-axis. (cc3bdmp2.cpp 40l.gif) |
|
 | |||||||||||||||||||||||||||||||||||||||||||||||||||||||||||||||||||||||||||||||||||||||||||||||||
|||||
| substrate surface crystal axis |
η | ν (cm-1) | mode type | Figure reference | ||||||||||||||||||||||||||||||||||||||||||||||||||||||||||||||||||||||||||||||||||||||||||||||||||
| [100] | 4.40 | 13.7 | football |
| ||||||||||||||||||||||||||||||||||||||||||||||||||||||||||||||||||||||||||||||||||||||||||||||||||
| [100] | 4.7 | 14.6 | football | Fig. 3(c) | ||||||||||||||||||||||||||||||||||||||||||||||||||||||||||||||||||||||||||||||||||||||||||||||||||
| [111] | 4.28 | 13.3 | ? | Fig. 3(g) | ||||||||||||||||||||||||||||||||||||||||||||||||||||||||||||||||||||||||||||||||||||||||||||||||||
| [111] | 4.52 | 14.1 | football | Fig. 3(e) | ||||||||||||||||||||||||||||||||||||||||||||||||||||||||||||||||||||||||||||||||||||||||||||||||||
| [111] | 5.38 | 16.8 | football | Fig. 3(e) | ||||||||||||||||||||||||||||||||||||||||||||||||||||||||||||||||||||||||||||||||||||||||||||||||||
| [111] | 5.6 | 17.4 | football | Fig. 3(f) | ||||||||||||||||||||||||||||||||||||||||||||||||||||||||||||||||||||||||||||||||||||||||||||||||||
| [111] | 0.8 | 2.5 | z axis twist | Fig. 3(h) | ||||||||||||||||||||||||||||||||||||||||||||||||||||||||||||||||||||||||||||||||||||||||||||||||||
| [111] | 0.5 | 1.6 | side to side |
| ||||||||||||||||||||||||||||||||||||||||||||||||||||||||||||||||||||||||||||||||||||||||||||||||||
| Figure 4. (C++ computer program used: cc3bdmp2.cpp) | |||||||||||||||||||||||||||||||||||||||||||||||||||||||||||||||||||||||||||||||||||||||||||||||||||
| (a) (cc3bdmp2.cpp 40g.gif) |
 |
 | |||||||||||||||||||||||||||||||||||||||||||||||||||||||||||||||||||||||||||||||||||||||||||||||||