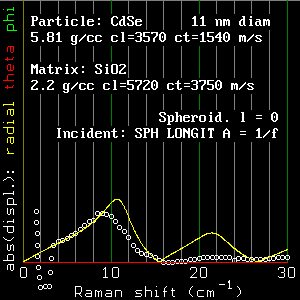
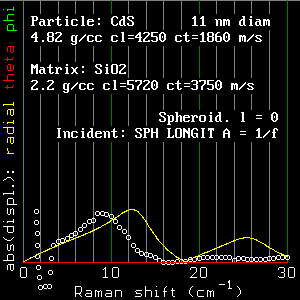
(left: CdSe, right: CdS)
as a function of frequency.
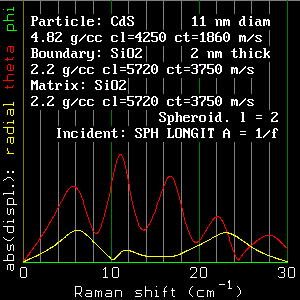
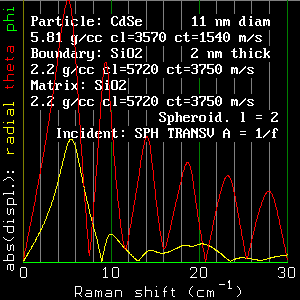
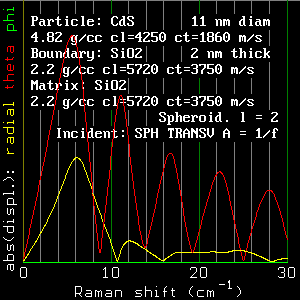
Grey circles are representative Raman spectrum data points from FIG. 4 in Champagnon et al. J. Appl. Phys. 73, (1993) 2775-2780, vertically rescaled for best fit with the yellow line.
(scp79e.c 33c.gif 33g.gif)