
| Economic Models | Production Possibilities Frontier | Comparative Advantage | Circular Flow Diagram | Uses of Economic Models |

The Production Possibilities Frontier (or Curve) is used to graphically show trade-offs in a simplified economy, which produces only two goods. It is a good way to show an economy's efficiency in the methods of its production, opportunity cost (something that is given up in order to gain something else), increasing opportunity cost, and an economy's growth.
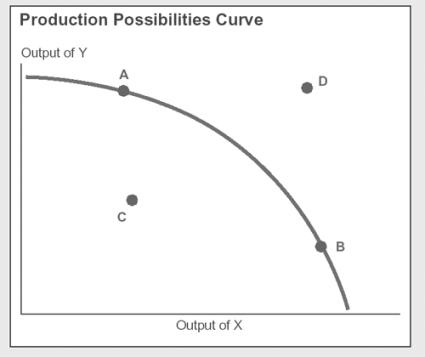
- If the point is on or inside the curve (points A, B, C above), the production of that combination of outputs X and Y is possible
- If the point is inside the curve (point C above), although it is possible, it is not the most efficient combination of outputs, meaning the economy can produce more of both products if all its resources are used efficiently
- If the point is on the curve (points A and B above), it means it is the most efficient combination of outputs, meaning all resources of the economy are used efficiently
-
If the point is outside the curve (point D above), then the production of that combination of outputs X and Y is not possible
 |
|
Economic Models | Production Possiblities Frontier | Comparative Advantage | Circular Flow Diagram | Uses of Economic Models
![]()