| Chapter 15 Homework Homework #9 Key terms page 390 Homework #10 Notes pages 377-380 Do #22,23,24 page 391 Homework #11 Define and draw a labled diagram of a manometer and a barometer Take notes on page 381 sample problem; Do#1-8 page 382 Homework #12 Do #25-28 & 40 page 390-391 Homework #13 Notes pages 384-385; Do #9,10 page 385; Do #29,30 page 391 Homework #14 Do #31,32,33 page 391 Homework #15 Notes page 385-387 Do #16 page 388; #34,35,43 page 391 Homework #16 Do # 44,45,46,48,49,50 and 51 page 392 TEST Chapter 15 EXTRA CREDIT! Print out one of these pictures and explain what is happening in terms of kinetic molecular theory and pressure. |
 |
| As nitrogen gas is heated, molecules gain kinetic energy (that is, they speed up) Each molecule has its own velocity, but the proportion of molecules which are going faster increases. The blue line represents the colder, slower atoms.Their speeds are more similar than the hotter, faster molecules. |
 |
| This is a picture of a closed end manometer. You can see that the gas, A, is pushing harder than the gas, B. This means that A has higher pressure than B. |
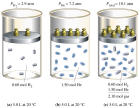 |
| In the manometer above, B would be one of the gases on the left side of this picture, it has less molecules pushing against the mercury. "A" would be one of the gases to the right of "B" because each molecule increases the forces pushing the masses upwards. |

|
| helpful links Simulation of moving gases: Check out how gases move with time and at different temperatures. Visual Definitions of the states of matter. Text to help you understand Gas Laws. |
 |