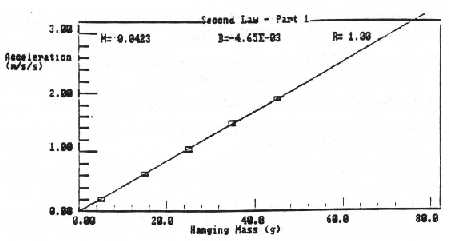
Here is a Sample Graph "a vs. ma" in Procedure 9.
| Lab 3 of 40A| Main Menu Page| Lab 5 of 40A|
Lab 4, Newton's Second Law, Part I,
02/18/2000Courtesy of Chiung-Yuan Lin
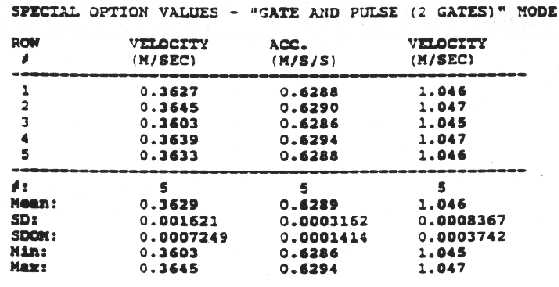 Here is a sample data table in Procedure 6.
Frequent Problems on Performance
Here is a Sample Graph "a vs. ma" in Procedure 9.
Additional Notices
Procedure 6
Don't press
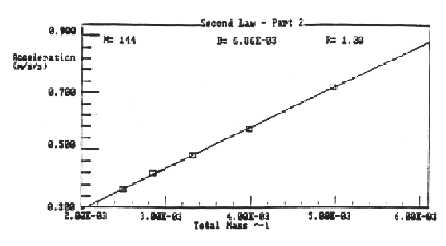
Here is a Sample Graph "a vs. 1/(m+ma)" in Procedure 12.
Procedure 8
We move the weights from the glider to the hanger because we like to keep m+ma fixed.
Procedure 13
Don't forget to adjust the photo-gate heights. If necessary, reverse the connections for gate 1 and gate 2 so that gate 1 is uphill.
The height of the metal block is h, and the distance between the track legs along the track (not along the horizontal) are D. Then the angle is, roughly, q @ sinq = (h/D) Þ g ´ sinq = g ´ (h/D)
Outline for Newton's Second Law _Part I
Courtesy of Benli Young
1. Glider length: _________________, Unit:( )
|
Item |
Mass, Unit:( ) |
|||
|
Hanger |
|
|||
|
Glider |
|
|||
|
Small Weights |
|
|
|
|
|
Large Weights |
|
|
|
|
2. Do not print out the "data tables" of measurement, which are required in procedure 6 and 7.
3. Refer to Procedure 8. Make measurement with total mass fixed.
Total mass, (m+ma) = glider + 4 small weights + hanger = _________, Unit:( )
| Hanging mass ma, Unit:( ) |
Measured Acceleration a with SDOM, Unit: ( ) |
Theoretical Acceleration mag/(m+ma), Unit: ( ) |
%Error (Optional) |
|
|
5 (hanger’s) |
|
± |
% | |
|
(5+10) |
|
± |
% | |
|
(5+20) |
|
± |
% | |
|
(5+30) |
|
± |
% | |
Refer to Procedure 9. Print out a graph of "a vs. ma" and compare the slope with "g/(m+ma)".
4. Keeping ma fixed at 15 grams and varying m with the large weights gives the data.
|
Total mass m+ma, Unit:( ) |
Measured Acceleration a with SDOM, Unit: ( ) |
Theoretical Acceleration mag/(m+ma), Unit: ( ) |
%Error (Optional) |
|
|
(186+15) |
± |
% | ||
|
(186+50+15) |
± |
% | ||
|
(186+100+15) |
± |
% | ||
|
(186+150+15) |
± |
% | ||
Question 12-1: (2 points) Refer to Procedure 12.
5. Refer to Procedure 13. Measurement of acceleration on the inclined plane:
The thickness of metal block (h): _________________, Unit:( )
The distance between the supporting legs (D): _________________, Unit:( )
The angle of the inclined plane Θ @ sinΘ= (h/D) = _________________.
Therefore, g = a/sinΘ or a = g ´ sinΘ = g ´ (h/D).
|
Glider mass m, Unit:( ) |
Measured Acceleration a with SDOM, Unit: ( ) |
Theoretical Acceleration g(h/D), Unit: ( ) |
%Error (Optional) |
|
|
186 |
± |
% | ||
|
(186+50) |
|
± |
% | |
|
(186+100) |
|
± |
% | |
|
(186+150) |
|
± |
% | |
Question 15-1: (2 points) Does acceleration depend on the glider mass?
Requirement:
I am a skeptical TA. I will say that according to your Data Table and Graph, maybe acceleration does depend on the glider mass like an exponential function or something. And because of that, all physics textbooks have to be re-written. How will you defend "Newton's second law"? How will you do to support the agreement between your theoretical predication and your experimental measurement?
Question 15-2: (2 points) Does acceleration depend on what distance above the first photo-gate the glider starts? Try a few different distances.
Requirement: Follow the given hint in Question 15-1. It is time for you to design an experiment to answer this question.
Reminder:You should make a theoretical prediction at first. Secondly, you should present a data table and/or a graph of your experimental measurements. Then, compare and discuss your theoretical prediction and experimental result. Furthermore, discuss differences between them if they do not agree with each other. All comparisons should be quantitative and better in percentage. Each of your statements should have a reason based on a theoretical equation or a quantitative experimental calculation.
| Lab 3 of 40A| Main Menu Page| Lab 5 of 40A|
My Home Page