 | ||||||
| Articles | Projects | Resume | Cartoons | Windsurfing | Paintings | Album |
Musqueam Salmon Stream
Restoration Project

Water Quality Analysis Project 1997

Summary and Discussion
Summary of Data:
The comprehensive multivariate statistical analysis of the baseline data for the field water quality parameters and the laboratory metals tests was completed with the Statistical Analysis Software at Langara College. Any questions regarding the details of this comprehensive multivariate analysis should be directed to Kelly Sveinson at Langara College, Chemistry Department.
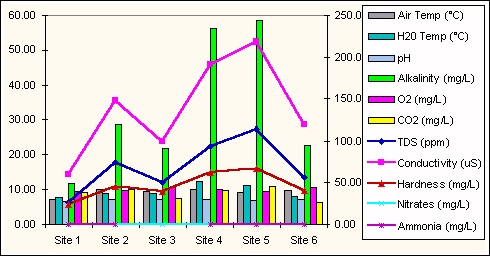
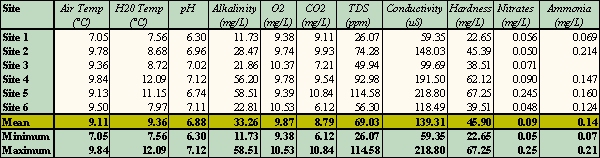
In the meantime, the summary of the descriptive statistical analysis of the water quality information is illustrated in Figure 1 and Table 1.
Analysis of Data:
Overall, the average water quality of the creek system is within acceptable parameters. The mean pH is 6.88 which is well above the minimum requirements. The water is well oxygenated, probably due to the shallow depth which increases turbulence. The TDS, conductivity, and hardness fall well within the expected range for a small surface stream in this area. The nitrates are below the 0.5 ppm (mg/L) maximum. The ammonia is below the 0.2 ppm (mg/L) with the exception of site two which slightly exceeds the threshold level. While the means represent the overall averages of data points and exclude extreme outliers, the ranges of these measurements at individual sites fluctuate depending on season, flow rates, precipitation, and other inputs.
It is interesting to note the correlation between conductivity, TDS, hardness, and alkalinity illustrated in Figure 1 which makes sense given the relationship between these variables. The prominent peaks at site four and site five represent water that is discharged from the two culverts into the creek system. Site two is located in an area that is influenced more from anthropogenic activities. Sites one, three, and six, are located in locations that are less influenced by anthropogenic activities.
Future Study:
Another interesting form of analysis would be to use a Geographical Information System Analysis approach (GIS). An interesting enhancement to the water quality program would be to record actual precipitation amounts at each site, and spatially map out the vegetation of the area. The GIS analysis and overlays could be used to analyse the spatial impacts of natural potential sources of substances versus unnatural potential sources of substances and the areal dispersion of those substances from point sources.
A separate study on the creek system illustrated that there is a correlation between precipitation amounts and pH (Burke, 1997). Furthermore, precipitation events cause pulses of flushing of substances from the soil profiles into the water table.
Additional Contact Information
Contact Kelly Sveinson at Langara College, Chemistry Department.
References
Burke, J. 1997. The Relationship Between Precipitation and pH on Musqueam Creek System. Unpublished Study. Vancouver, B.C.Environment Canada. 1993. Quality Assurance in Water Quality Monitoring. Ottawa.
Page, N. 1993. Musqueam Creek Restoration Plan. Unpublished Thesis. Vancouver, B.C.
Sigmund, C.A. 1996. Pristine Waters: Examining the Chemistry of Streams, Lakes, and Rivers. Langara Press. Vancouver, B.C.
Next: Water Testing Escapades & Cartoons
- Introduction
- Site Location: Map and Graphics
- Field Water Chemistry Tests
- Summary
- Water Testing Cartoons on Musqueam Creek by the Waterose

 email Waterose
Please Sign My Guestbook
Please View My Guestbook

| Articles | Projects | Resume | Cartoons | Windsurfing | Paintings | Album |
 | ||||||