Results
The ANOVA and MANOVA analyses allows comparisons between conditions to determine what differences (or similarities) exist. The regression analysis examines the predictability of evaluating components, in that non-related measures (e.g., age) can be compared to performance scores to see if these measures serve a predictive ability. In doing this, one may discover that knowing how one performed on a particular component (e.g., of a driving evaluation) would predict their performance for the entire set of components (e.g., the entire examination).
Participant Mortality
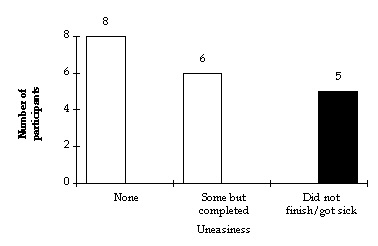
Simulator Sickness. It is important to note that of the 19 participants who began the study, only 14 were able to finish the simulator session. Of those 14, 6 reported some uneasiness, but were able to finish the session. Only 8 of the 14 (58%) reported no uneasiness, as indicated in Figure 6. The drop out rate (26.3%) seems to have been a result of simulator sickness experienced by these participants.
Overall Driver Evaluation Scores
Environment. The question of interest involves comparing overall road driver performance scores to simulator driver performance scores to discover if order is preserved between the two environments. In other words, does a driver who scores "good" in one environment score "good" in the other environment? To begin to answer this question the scores for each participant were grouped into categories of performance, following the categories for the overall score from the Driver Results Form (Appendix D). These were "Good" (119-132), "Fair " (99-118), "Needs Training" (80-98), and "Poor" (<80). The Pearson Product-Moment correlation (r) between these categories for Road and Simulator is .14 (p > .10), signifying a low relationship between conditions. While all participants were rated above the "Poor" category, 50% of participants received a score for one condition that differed from their score for the other condition. Approximately half of the people who were rated "Fair" for one condition, were rated "Needs training" in the other or vice versa.
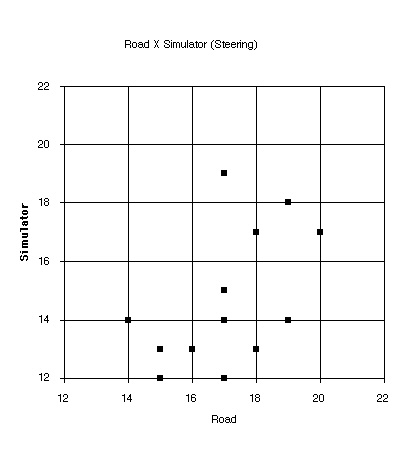
On the other hand, the correlation (r) between Overall Road Score and Overall Simulator Score is .41, p = .07 (17% of the variability is accounted for) as shown in Table 4 and depicted in Figure 7.
______________________________________________________
        Ssc     Age     CFQ     RT      Acc     Tx
Rsc     .41    -.48    .23     -.50    -.29     .16
 Ssc      -     -.05   -.14     -.52    -.09    -.60*
Age      -       -     .06      .57*   -.23    -.40
CFQ      -       -      -      -.11     .12    -.04
RT       -       -      -        -     -.30    -.13
Acc      -       -      -        -       -      .09
______________________________________________________
* P < .05
Table 4. Pearson's R Correlation Matrix (cont.)
______________________________________________
        Age     CFQ     RT      Acc     Tx
Rsc     -.48    .23    -.50    -.29     .16
 Ssc     -.05   -.14    -.52    -.09    -.60*
Rst     -.15   -.40    -.27    -.08    -.06
Sst     -.10   -.34    -.33    -.07    -.17
Rbk     -.39    .14    -.68*   -.17     .09
 Sbk     -.01   -.18    -.12     .10    -.72*
Rac     -.30    .23    -.28    -.49    -.19
Sac     -.31   -.03    -.75*   -.06    -.41
Rca     -.33    .24    -.37    -.20     .33
 Sca      .24   -.10    -.26    -.11    -.75*
Rad     -.72*   .44    -.46     .02     .25
Sad     -.39    .08    -.69*   -.15     .15
______________________________________________
* P < .05
Table 4. Pearson's R Correlation Matrix (cont.)
________________________________________________________________________________
     Ssc    Rst    Sst    Rbk    Sbk    Rac    Sac    Rca    Sca    Rad    Sad
Rsc   .41   .34     .44    .79*  -.05    .76*   .51    .90*   .26    .69*   .46
Ssc    -    .57*    .71*   .49    .70*   .30    .90*   .22    .92*   .07    .40
Rst    -      -     .53*   .32    .33    .13    .45    .16    .55*  -.01    .17
Sst    -      -      -     .28    .40    .24    .49    .40    .58*   .14    .24
 Rbk    -      -      -      -    -.02    .60*   .66*   .62*   .36    .51    .59*
Sbk    -      -      -      -      -    -.06    .53*  -.17    .65*   .02   -.03
Rac    -      -      -      -      -      -     .46    .50    .34    .46    .39
 Sac    -      -      -      -      -      -      -     .30    .73*   .26    .59*
Rca    -      -      -      -      -      -      -      -     .09    .56*   .32
Sca    -      -      -      -      -      -      -      -      -    -.17    .10
Rad    -      -      -      -      -      -      -      -      -      -     .36
_________________________________________________________________________________
* P < .05
(for variable abbreviation meanings, see Table 3)
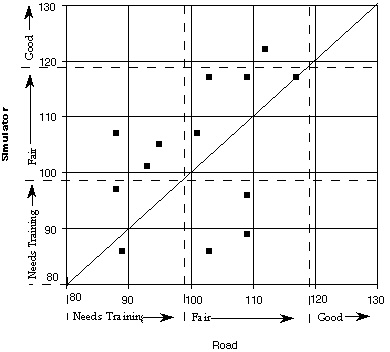
Figure 7. Overall Road Score X Overall Simulator Score (r
= .41)
For the actual data in this experiment, while the relationship did not reach statistical significance, it is encouraging to see a moderate correlation with such a small sample size (N = 14).
Having looked at the order relationship between overall Road and Simulator scores, one can then ask, "Are evaluation scores consistently higher or lower in one environment than in another?" For example, it is possible that the driver performance as evaluated on the simulator might always be higher, because less feedback is available, as compared to actual driving on the road. If simulator scores are consistently higher than the road scores, then the scale for simulator evaluation would have to be adjusted down. To answer the above question, an ANOVA was conducted on the Overall evaluation scores. This was performed to determine whether there were overall differences in scores. As shown in Figure 8, this revealed no main effect for Environment, F (1,12) = 1.72, n.s., as the mean Overall Road Score (101.21) and Overall Simulator Score (103.86) were roughly equivalent (see Table 5 for descriptive statistics). Thus, while there is not a highly reliable relationship between on-road and simulator assessment scores, the average overall score across drivers in both environments was the same.
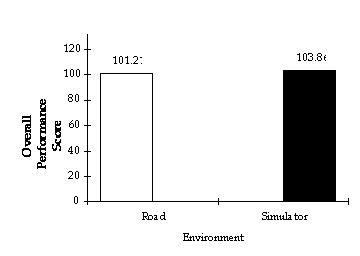
Figure 8. Main Effect of Environment on Overall Performance Score
       Abbreviation          Mean               Standard Deviation
    CFQ               32.57                   10.68
    RT                  .46                     .06
    Rsc              101.21                    9.44
    Ssc              103.86                   11.94
    Rst               17.14                    1.70
    Sst               14.86                    2.32

    Rbk                9.86                    1.03
    Sbk               13.29                    1.86
    Rac               18.14                    3.01
    Sac               18.57                    3.32
    Rca               41.79                    5.00
    Sca               42.86                    5.80
    Rad               14.29                    1.86
    Sad               14.29                    1.73
 Measure               Yes                      No
       Acc                 6 (43%)                  8 (57%)
        Tx                 4 (29%)                 10 (71%)
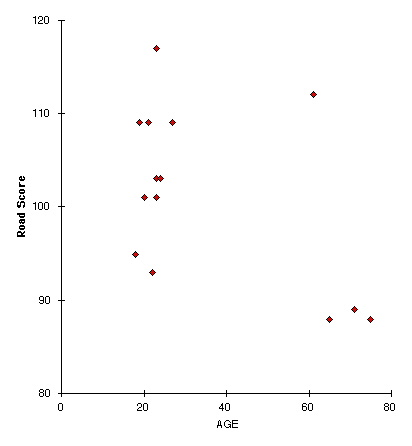
Age. The correlation of Age and Overall Road Score was significant, as expected, indicating that Road Scores increased as Age decreased (r = -.48, p < .05) as shown in Figure 9.
For Age and Overall Simulator Score, it was not significant (r = -.05, n.s.). The MAVOVA revealed significant differences between age groups and for the two environments; there was no main effect for Age and no interaction for Age and Environment (p > .10).
Age, Accidents, CFQ, RT, and Tickets. A forward stepwise regression analysis was also performed to see if any of these components predicted overall simulator and road scores. Age, Accidents, CFQ, RT, and Tickets were regressed on both Overall Simulator Score and Overall Road Score. For the Overall Simulator Score, Tickets was entered first and accounted for 35.6% of the variability. RT was entered second and, together, Tickets and RT accounted for 72.1% of the variability, as illustrated in Figure 10.
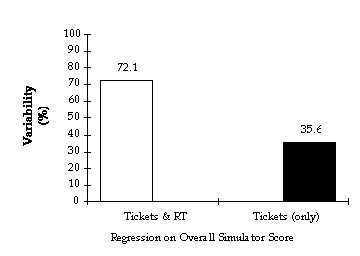
Figure 10. Regressing Age, Accidents, CFQ, RT, and Tickets
on Overall Simulator Score
None of the other variables (Age, Accidents, or CFQ) was entered into the regression equation. For the Overall Road Score, none (not Age, Accidents, CFQ, RT nor Tickets) entered into the regression equation with an inclusion criterion of alpha = .05. People in the Younger group had an average RT of .44, as opposed to people in the Older group, who had an average RT of .52. While only a moderate relationship exists between Overall Scores for Road and Simulator, one may learn more precisely where differences between the two environments lie. Let us next look at the sub-component scores as a function of Environment and Age.
Steering Sub-Component Score
Environment. For the Road and Simulator, the Steering scores were significantly and positively correlated (r = .53, p < .05) as shown in Figure 11.
The MANOVA revealed a main effect of Environment on the performance score for Steering, univariate F (1, 12) = 13.43, p < .01. As shown in Figure 12, steering performance on the Road was higher (17.14) than steering performance on the Simulator (14.86).
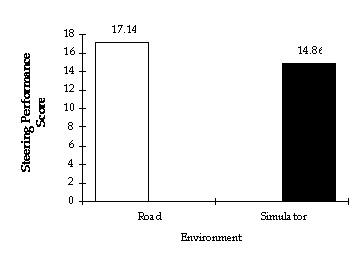
Figure 12. Main Effect of Environment on Steering Performance Score
Age. The correlation of Age and Steering Score on the Road was not significant (r = -.15, n.s.), nor was the correlation for Age and Steering Score on the Simulator (r = -.10, n.s.). The MANOVA revealed no effect of Age on Steering Score, F (1, 12) = .24, n.s.
Braking Sub-Component Scores
Environment. For the Road and Simulator, the correlation between Road Braking Score and Simulator Braking Score was not significant (r = -.02, n.s.). The MANOVA revealed a main effect of Environment on Brake performance score, F (1,12) = 30.86, p < .01. As shown in Figure 13, Braking performance was higher on the Simulator (13.29) than for the Braking performance on the Road (9.86).
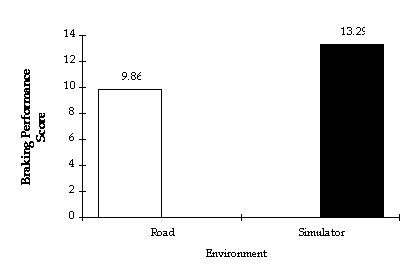
Figure 13. Main Effect of Environment on Brake Performance Score
Age. The correlation of Age and Braking Score on the Road (r = -.39, n.s.), and Age and Braking Score on the Simulator (r = -.01, n.s.) were both not significant. The MANOVA revealed no effect for Age and Braking Score, F (1, 12) = .50, n.s.
Acceleration, Caution/Safety, and Additional Skills.
Environment. For the Road and Simulator, the correlation between Road Acceleration Score and Simulator Acceleration Score was not significant (r = .46, n.s.), the correlation between Road Caution/Safety Score and Simulator Caution/Safety Score was not significant (r = .09, n.s.), and the correlation between Road Additional Skills Score and Simulator Additional Skills Score was not significant (r = .36, n.s.)
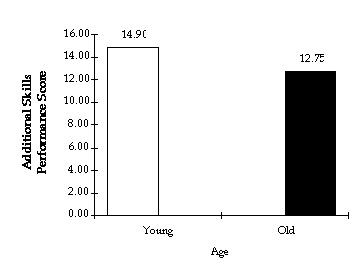
Age. The MANOVA revealed no main effect for either Acceleration F (1, 12) = 1.78, n.s., or Caution/Safety Skills, F (1, 12) = .01, n.s. The MANOVA did reveal a significant main effect of the Additional Skills sub-component, F (1, 12) = 10.46, p < .01. As shown in Figure 14, the participants in the Younger group scored higher (14.9) than the participants in the Older group (12.75). For the remaining categories of Acceleration and Caution/Safety no significant differences were found.
Figure 14. Main Effect of Age on Additional Skills Performance Score