Method
In the present experiment specific driver information was collected through
self-reported Driver History and Cognitive Failure questionnaires (see
Table 1) from a range of licensed drivers between
the ages of 18 and 75. In addition, a driver reaction time test was administered
to all participants. Finally, both on-road and simulated OT driving evaluations
were administered in a counterbalanced fashion.
Table 1. Tests Used to Collect Data on Abilities
Related to Driving Skill
Driver History:
Age
Accidents (within last five years - Yes or no)
Tickets (within last three years - Yes or no)
Cognitive Failures Questionnaire:
Rating of self-reported failures
Driving RT Test:
Simple Reaction Time
Driving evaluations:
Road performance
Simulator performance
Design
A 2 X 2 mixed factorial design was employed with driving Environment
(Road and Simulator) varied within subjects and Age (Younger < 45 years,
Older > 45 years) varied between subjects.
Participants
The 19 participants in the study were licensed drivers (age 18-75).
All participants had normal or corrected-to-normal vision and valid California
drivers licenses. The participants were recruited through newspaper and
posted advertisements that offered $5.00 per hour to healthy drivers for
participation in an experiment involving an on-road evaluation and a driving
simulator.
Participants were recruited through a local university, a hospital, and
a local senior center. Of the 14 participants who completed all sessions
of the study, 10 were in the Younger group and four were in the Older group.
Apparatus and Stimulus
Orientation. Upon arrival, verification of both a current driver's
license and proof of automobile insurance was carried out. The first portion
of each session included an orientation in which the purpose of the study
was explained (see Appendix A) and various forms were completed as required
by the Santa Clara Valley Medical Center. Also, the Driving Questionnaire,
shown in Appendix B, was used to determine basic driving information.
An additional questionnaire, the Cognitive Failures Questionnaire (CFQ)
(Broadbent, Cooper, FitzGerald, & Parkes, 1982), was also completed
(see Appendix C). The CFQ asks questions of participants about minor mistakes,
lapses of attention, or instances of forgetting that occur from time to
time. This questionnaire, previously utilized in a driver study by Andre
(1991), was used to assess self-reported failures in perception,
memory, and motor function in drivers.
Driving Reaction Time Test. The reaction time test was administered to determine simple reaction time, utilizing the Instructo-Clinic Testing Apparatus (Bumpa-Tel�, Inc., 1973). This apparatus is for testing depth perception, visual acuity, peripheral vision, color determination, and simple and complex reaction time, and was used to test and measure simple reaction times in this study. The unit consists of simulated gas and brake pedals with a series of red, yellow, and green lights to test reaction time. The task involved depressing the gas pedal to illuminate a green light. When the red light was activated, the participant was to brake as quickly as possible by stepping on the brake pedal. After a series of practice trials, three trials were given; the average of these three trials was reported.
On-Road Evaluation. The driving evaluation for this study was based on the Adaptive Driving Evaluation Program at the Santa Clara Valley Medical Center (SCVMC). The on-road evaluation was conducted in SCVMC's 1989 Oldsmobile Cutlass Cierra evaluation vehicle, with column shift, power seat adjustment, power assisted steering, and dual instructor brake.
The on-road route was designed to allow a variety of typical, everyday driving situations to be encountered. This route included parking lot driving, and both business and residential street driving up to 40 m.p.h. No freeway driving was included.
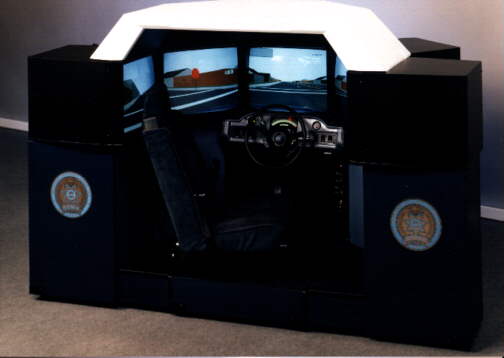
Simulator Evaluation. The simulated drive evaluation used a Time Warner 5-screen driving simulator, equipped with standard vehicle controls, including turn indicator, column shift, seat belt, and steering wheel (Figure 1). This is a single-operator unit in a configuration that produces a 225-degree panoramic field of view (Nowicki, 1994). Each of the 25-inch screens has a resolution of 512 X 384 pixels. The frame update rate varies from 12-20 frames/sec (12-20 Hz) depending on how many vehicles are in the scene at any one time. A series of microprocessors compose the system including a sound microprocessor that generates realistic auditory feedback (e.g., tire skidding sounds when stopping or turning too sharply).
According to Time Warner Interactive Simulation Products (1994):
The simulator is controlled by a network of microprocessors which update
the simulated vehicle's position and the driver's viewpoint. A mathematical
model of vehicle dynamics gives the simulator its realistic response to
road conditions and the driver's controls. Typical vehicle dynamics characteristics
such as acceleration, suspension reaction, braking, and cornering forces
are included in the model calculations. The driver's "hands-on"
feel of the vehicle is simulated by physical forces transmitted through
the steering wheel. Road and engine vibrations are additional forms of
physical feedback (transmitted through the steering wheel and seat).
Similar to the on-road route, the simulated evaluation route was designed to allow a variety of typical driving situations to be encountered. This route included business and residential street driving up to 35 m.p.h. No freeway driving was included.
The route characteristics of the simulated drive portion of the experiment had many similarities as compared to the on-road route (see Table 2). For example, the mileage, duration and number of left turns, stops signs, lane changes, and backing up and parking maneuvers were approximately the same for both environments. However, some aspects, such as the number of right turns, traffic signals, U-turns, three-point turns, vehicles, and speed signs differed between the two environments.
| Road | Simulator | |
| Mileage | 8.3 miles | 7.8 miles |
| Duration | 25-35 mins. | 24-35 mins. |
| Left turns | 11 | 10 |
| Right turns | 12 | 19 |
| U-turns | 3 | 1 |
| 3-point turns | 1 | 3 |
| Traffic signals | 11 | 21 |
| Stop signs | 10 | 11 |
| Speed signs | 9 | 3 |
| Lane changes | 5 | 5 |
| Backing up | 2 | 2 |
| Parking | 2 | 2 |
| Vehicles | 100s | 97 |
Limitations of the simulator route accounted for the dissimilarities; the lack of long roadway segments resulted in the need to increase the number of right turns to allow the simulated portion to include approximately the same mileage as the on-road portion. The higher number of light signals in the simulator, as well as the lower number of pedestrians, bicycles, and vehicles was also a limitation of the simulation system. Likewise, the lower number of pedestrians, bicycles, and vehicles, and speed signs was a limitation of the simulated road program (i.e., the more objects that were present at any one time, the slower the update and processing rate of the system).
The differences between the environments seemed acceptable. For instance,
the lower number of U-turns on the simulator was compensated for by an
increased number of three-point turns, which involved the same sorts of
driving skills and abilities as a U-turn. Another limitation of the simulator
was the fewer number of vehicles and pedestrians encountered. Although
it was very important to assess one's ability to properly respond to traffic
on-road, the simulator allowed specific, typical driving situations to
be programmed. Participants encountered fewer vehicles during the route,
but the evaluator was able to successfully score the participant's performance
during these expected driving situations. The final potential limitation
of the simulator was the potential for simulator sickness.
Simulator Sickness Countermeasures Taken. To minimize the likelihood of simulator sickness incidence, the following countermeasures were established: Participants were informed that the session could be paused or terminated for any reason at any time. Water, sugar candy, and snack bars were made available. Participants were given a 4-minute orienting exercise, consisting of simple maneuvers, during which the participant had a chance to become familiar with the simulator and the objects in the simulated universe. Participants were required to get out of the simulator between the orientation and the 30-minute evaluation portion. The 30-minute simulator evaluation was divided into three 10-minute segments. After each segment, the participants were allowed to get out of the simulator. Water and restroom breaks were offered at these times. Before resuming the next session, participants were also reminded that the session could be paused at any time. An external fan was used to increase circulation in the experiment room. The overhanging glare cover of the simulator was positioned one foot back from its recommended position. This served to lessen a of feeling enclosure, that may contribute to simulator sickness. The room was air conditioned. The thermostat was set at between 68 to 70 degrees Fahrenheit. A restroom, just outside the experiment room, was available. The evaluators monitored each participant for warning signs of discomfort caused by the simulator (e.g., sweating, nervousness). For participants who experienced discomfort, a chance to rest and relax was given. An outside patio was available for breaks. Before exiting the simulator, the simulated vehicle was stopped.
Procedure
Each participant completed a three-hour orientation and data collection
session. Some sessions were completed in one, two, or three visits, due
to time and schedule constraints. This was due to the availability of the
experimenters, the participants, the evaluation vehicle, and the evaluation/driving
simulator room. After completing a 25-minute orientation, which included
completion of a series of forms, each participant took part in a 3-5 minute
Driver Reaction Time evaluation. Water and restroom breaks were offered
at the end of each portion. Following this, participants drove the on-road
route and the simulated drive route portions in a counterbalanced fashion.
Each driving portion of the experiment was divided into two parts: In the first part, participants were allowed to become familiar with the vehicle and its controls. For the on-road portion, this included a 5-minute review of the turn signal controls, mirrors, brake and acceleration pedals, horn, and a brief driving portion through a parking lot toward the actual route. For the simulator, the orientation included a similar review of the vehicle controls, and a "4-minute orientation" while driving the simulator. This driving orientation gave participants a brief experience with the simulator so they could better understand how the roadway and vehicle dynamics were portrayed (e.g., lane markings, curbs, traffic lights, vehicles).
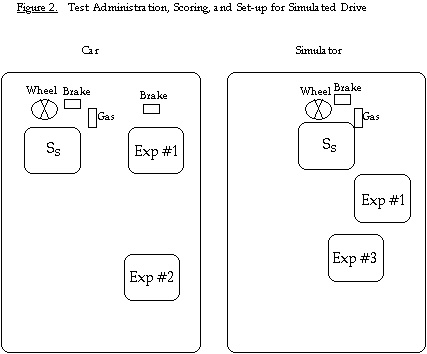
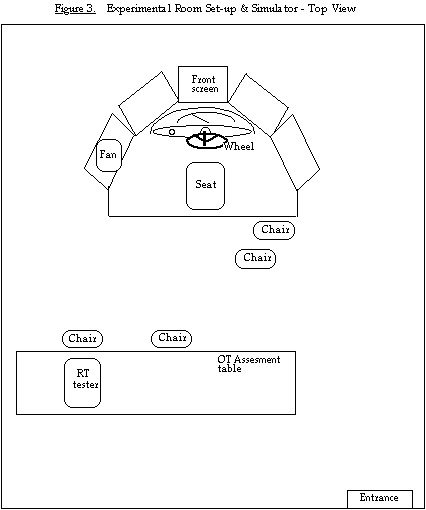
For the second part of each driving portion, participants drove a 30-minute route. For both the on-road route and the simulated route, the same experimenter administered the orientation and the route instructions. This person was a registered Occupational Therapist who had completed a standard 60-hour Driver Instructor Course and was certified by the Department of Rehabilitation as an Adaptive Driver Evaluator. Another experimenter collected driver performance data by way of the Driving Results Form (Appendix D) for each environment (i.e., for each environment a different experimenter scored each participant). The main benefit of having 2 different experimenters to collect driver performance data was that once a scorer sees how a person drives it would be difficult, if not impossible, to pre-judge them and not be biased in the other driving condition. The experimenters who scored each driver were trained in a similar manner to increase the likelihood of high inter-rater reliability for the experiment (r = .99, rank-order inter-rater reliability, n = 3). The scorers did not provide instructions, but fulfilled an observation role only. The scorers were positioned behind and to the right of the participant for each evaluation (see Figures 2 and 3) and completed observations of performance using the Driver Results Form.
Instructions for the "4-minute orientation exercise" administered
to familiarize each subject with the simulator are shown in Appendix E.
A similar set of instructions was administered for the 30-minute simulated
drive evaluation (Appendix F), and for the orientation and 30-minute on-road
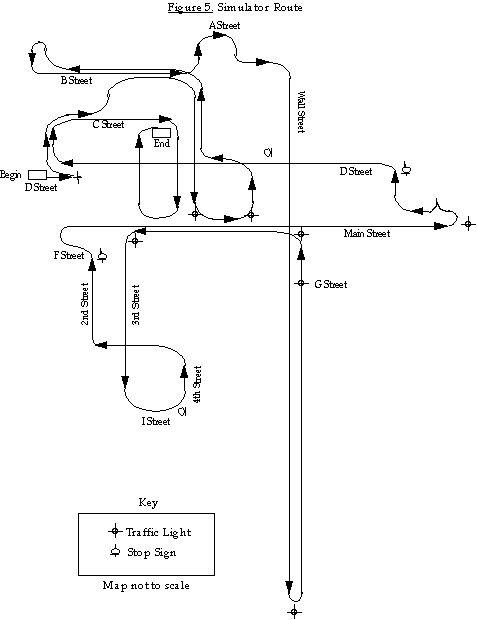
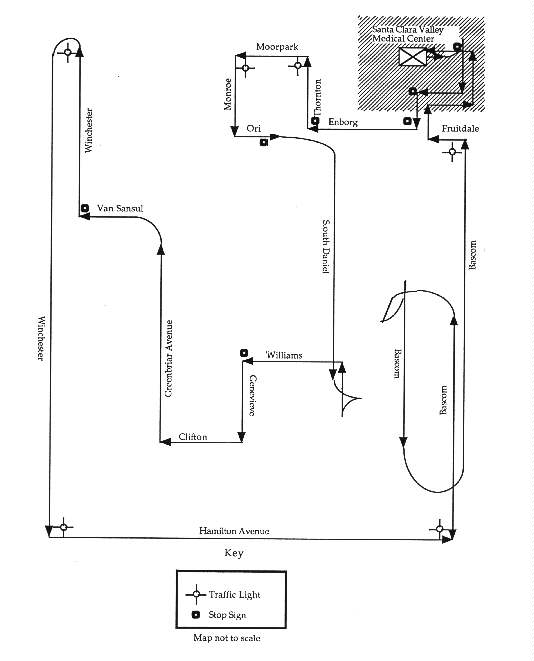
drive evaluation (Appendix G). The maps depicting the routes used in each
environment are shown in Figures 4 and 5.
The evaluation technique for the on-road evaluation followed the same criteria as the simulated driving evaluation: An Overall score, consisting of Steering, Braking, Accelerating, Caution/Safety Awareness, and Additional Driving Skills, was assessed using a 33-item version of a standardized scoring sheet (see Appendix D). Each of the thirty-three items was completed, based on a 5-point scale, 0 representing failure, 1 representing poor performance, 2 representing marginal performance, 3 representing satisfactory performance, and 4 representing consistently good performance.
Training of scorers
To attain a high inter-rater reliability the following training took
place: 1) Discussion of each of the 33 items of the questionnaire took
place. This served to more thoroughly explain what the scorer was looking
for when scoring each item. A review of behaviors and actions was discussed
that would result in scores ranging from poor (0) to consistently good
performance (4). 2) Several ride-alongs were completed. During these ride-alongs,
the experimenter who gave directions during the actual experiment reviewed
what sort of behaviors or actions the scorer would be looking for during
an evaluation. 3) During two of the ride-alongs, the experimenter giving
directions, the experimenter acting as the on-road scorer, and the experimenter
acting as the simulator scorer rode together to discuss scoring, item by
item along the route. 4) A similar process was followed with a ride-along
with the simulator, after which discussion took place about scoring along
the simulated route. 5) As a final step, both scorers went on three ride-alongs
with a pilot participant on-road and each separately scored the participant
using the score sheet. Discussion took place afterwards and each item on
the score sheet was compared for consistency in scoring. 6) A pilot participant
was independently scored by the two scorers in the simulator as well, but
the entire session was not completed, due to time constraints. 7) Inter-rater
reliability was calculated. A total of three participants were scored on
the road by both experimenters. The rank order inter-rater reliability
scores for the three subjects were 0.995, 0.989, and 0.989 with a mean
of 0.991.
Post experiment procedure
A debriefing interview (Appendix I) was conducted to access each participant's
subjective experience and to elicit input.
Analyses
The data were analyzed for the 14 participants who completed both the
on-road and simulator evaluations. Correlation and regression analyses
were conducted, and scores across environments and between age groups were
compared utilizing both an ANOVA and a MANOVA technique.
The dependent variables were analyzed as a function of Environment (Road and Simulator) and Age (Younger and Older). These were divided into three types of measures: driving performance, driving reaction time, and driving history data. The driving performance score measures consisted of the Overall Performance, Steering, Braking, Acceleration, Caution/Safety, and Additional Skills. The driving reaction time was an average of three trials of simple reaction time. The driving history measures were number of accidents, number of tickets, and a score from the CFQ (for variable abbreviations, see Table 3).
|
Abbrev. |
Variable |
Measure |
| Age | Age Group | 0 = young, 1 = old |
| CFQ | Cognitive Failures Questionnaire | max = 100 |
| RT | Reaction time | seconds (average) |
| Acc | Accidents | within 5 yrs; 0 = no, 1 = yes |
| Tx | Tickets | within 3 yrs; 0 = no, 1 = yes |
| Rsc | Road Score (Overall) | sum (33 items) |
| Ssc | Simulator Score (Overall) | sum (33 items) |
| Rst | Road Steer Score | sum (5 items) |
| Sst | Simulator Steer Score | sum (5 items) |
| Rbk | Road Brake Score | sum (4 items) |
| Sbk | Simulator Brake Score | sum (4 items) |
| Rac | Road Accelerating Score | sum (6 items) |
| Sac | Simulator Accelerating Score | sum (6 items) |
| Rca | Road Caution/Safety Awareness | sum (14 items) |
| Sca | Simulator Caution/Safety Awareness | sum (14 items) |
| Rad | Road Additional Driving Skills | sum (4 items) |
| Sad | Simulator Additional Driving Skills | sum (4 items) |