Variation is the basis of six sigma. It defines how much changes are happening in an output of a process. So if a process is improved then this should reduce variations. In six sigma we identify variations in the process, control them and reduce or eliminate defects. Now let’s understand how we can measure variations.
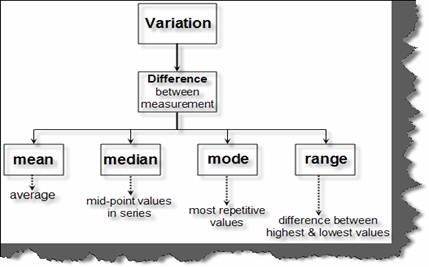
There are four basic ways of measuring variations Mean, Median, Mode and Range. Let’s understand each of these variations in more depth for better analysis.
Figure: - Different variations in Six sigma
Mean: - In mean the variations are measured and compared using math’s averaging techniques. For instance you can see the below figure which shows two weekly measures of how many computers are manufactured. So for that we have tracked two weeks one we have named as Week 1 and the other as Week 2. So to calculate variation by using mean we calculate the mean of week1 and week2. You can see from the calculations below we have got 5.083 for week and 2.85 for week2. So we have a variation of 2.23.
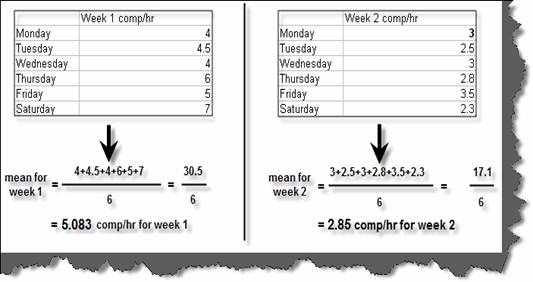
Figure: - Measuring variations by using Mean
Median: - Median value is a mid point in our range of data. Mid point can be found out using by finding the difference between highest and lowest value then divide it by two and finally add the lowest value to the same. For instance for the below figure in week1 we have 4 as the lowest value and 7 as the highest value. So first we subtract the lowest value from the highest value i.e. 7 -4. Then we divide it by two and add the lowest value. So for week1 the median is 5.5 and for week2 the median is 2.9. So the variation is 5.5 – 2.9.
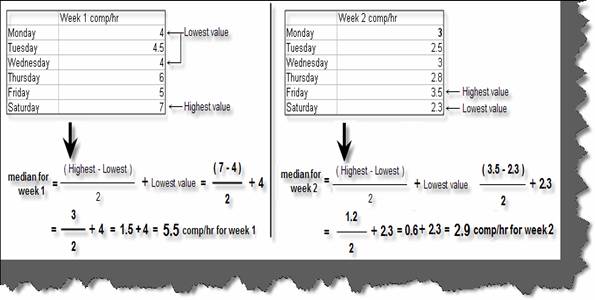
Figure: - Median for calculating variations
Range: - Range is nothing but spread of value for a particular data range. In short it is the difference between highest and lowest values in particular data range. For instance you can see for recorded computer data of two week we have found out the range values by subtracting the highest value from the lowest.
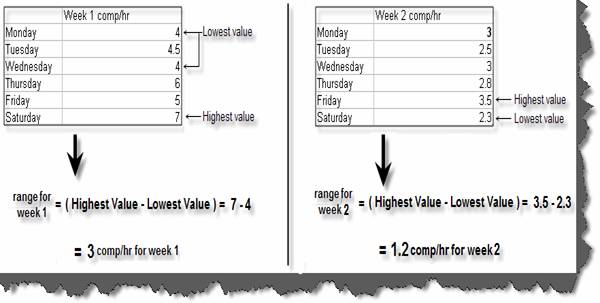
Figure: - Range for calculating variations
Mode: - Mode is nothing but the most occurred values in a data range. For instance in our computer manufacturing data range 4 is the most occurred value in Week1 and 3 is the most occurred value in week 2. So the variation is 1 between these data ranges.
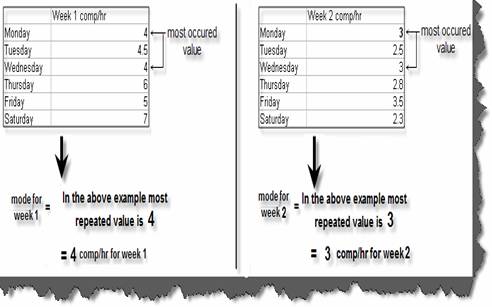
Figure: - Mode for calculating variations