PERT is again a network diagram. In CPM the activity durations are based on historic
data which has been performed many times. But what if an activity is not performed and this is the first time the activity is performed in the organization, that’s when PERT comes to help. CPM is used when the time lines of the activities are determestic while PERT is used when the timelines are not determestic.
PERT uses three time estimates to come to a conclusion regarding time estimates for a
activity.
Optimistic Time (a):-It’s the shortest time in which the activity can be completed.
Pessimistic Time (b):-It’s the longest time an activity might require.
Most Likely Time (m):-It’s the completion time which has the highest probability.
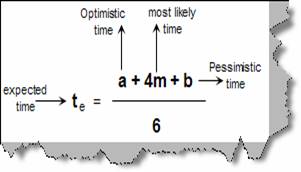
Figure: - PERT Computations
Now using the above three estimates we can calculate the expected time. Figure
‘Pert Computations’ shows the formulae in more detail where ‘a’ is the optimistic
time, ‘b’ is the pessimistic time, ‘m’ the most likely and ‘te’ the expected time.
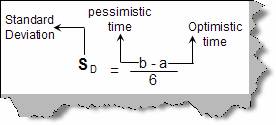
Figure: - Standard Deviation
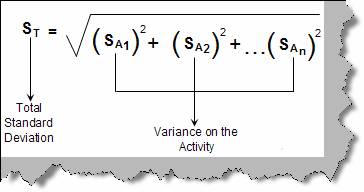
Figure: - Total Standard Deviation
Other than expected time there are two more important formula’s one is calculating the ‘standard deviation (Sd)’ and the other is ‘total standard deviation (St)’. Both the formulas are given in the figure ‘Standard Deviation’ and ‘Total Standard Deviation’. Terminology ‘a’,’b’ and ‘c’ remain same. SA1, SA2 are standard deviations which are calculated on the individual activity.
Let’s not talk about theory and let’s apply the above fundamentals to our institute project.
What we will do is apply the PERT fundamentals to two different probabilities only on
the CPM path of the computer institute. Below figure shows the two probability and the
calculations. We can see from the calculations the two probabilities one and two. We can
also see the standard deviation of probability one is less than probability two. So
probability one has more stability and can hence become our valid plan. Apply the
formulas (PERT, Te, Sd and St) explained previously to the diagram.
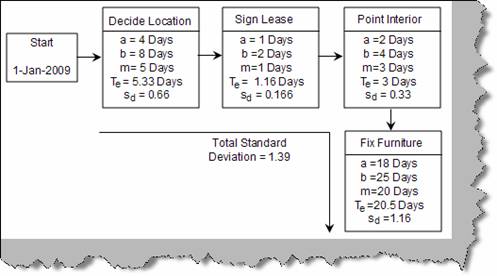
Figure: - Probability One
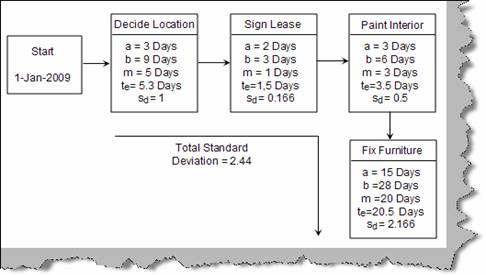
Figure: -Probability Two
Note: - We use PERT when we have not performed that activity any time before. We use CPM when we have history about the acitivity and we have perfomed the activity atleast once. So a project manager should be aware of when to use both the diagrams. During interview this is on the favorite question when will you use CPM and when will you use PERT.