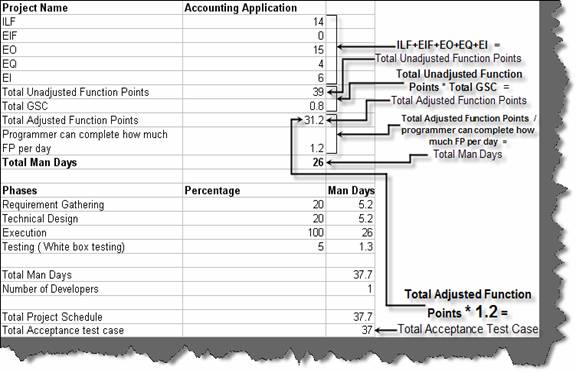
Total acceptance test cases = total adjusted function points multiplied by 1.2
The total estimate for this project is 37.7 man days.
Figure: - Total estimation of the accounting application
Now that we have completed the function point analysis for this project lets move to the second step to calculate black box testing using TPA.
Step 2:- Calculate Df (Function dependant factors)
Df is defined for each function point. So all the function point description as well as value is taken and Df is calculated for each of them. You can see from the figure below how every function point factor is take and Df calculated for the same.
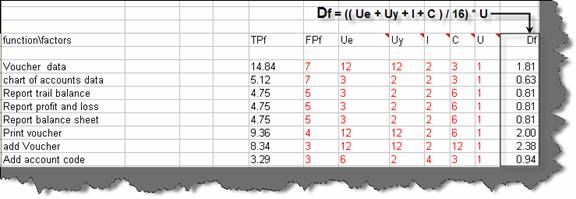
Figure: - Df calculated
But we have still not seen how Df will be calculated. Df is calculated using four inputs User importance, Usage intensity, Interfacing and Complexity. Below figure show the different inputs in a pictorial manner. All the four factors are rated with Low, Normal and High and assigned to each function factors derived from function points. So let’s understand these factors step by step.
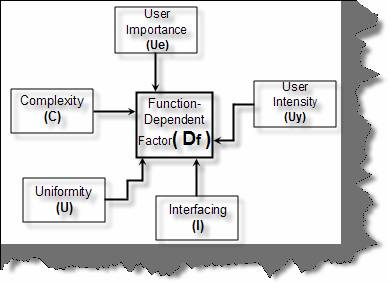
Figure: - Factors on which Df depends
User importance (Ue): - How important is this function factor to the user and compared to other function factors. Below figure shows how they are rated. Voucher data, Print voucher and Add voucher is rated with high user importance. With out these the user can not work at all. Reports have been rated low because they do not really stop the user from working, definitely they are of high importance but not as high as the add voucher and print voucher. Chart of accounts master is rated low because the master data is something which is added one time and can also be added from the back end.
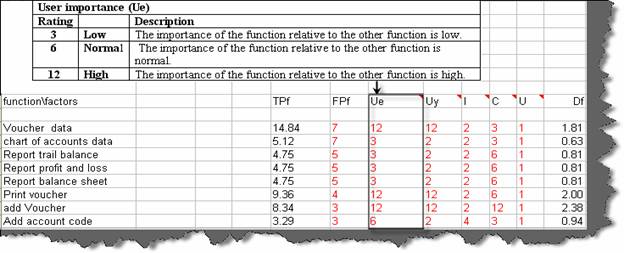
Figure: - User importance
Usage intensity (Uy): - This factor tells how many users use it and how often. Below figure shows how we have assigned the values to each function factors. Add voucher, print voucher and voucher data is the most used function factors, hence they are rated high. Other all function factors are rated as low.
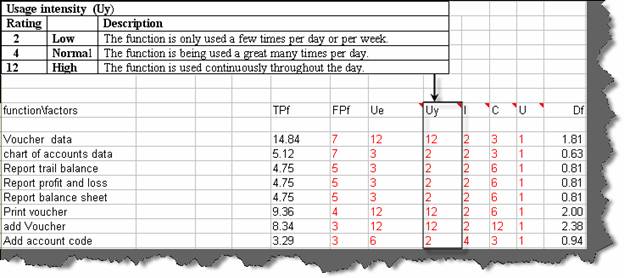
Figure: - Usage intensity
Interfacing (I): - This factor defines how much impact does this function factor affect the other parts of the system. But how do we now find the impact?. In TPA concept of LDS affected is used to determine the interfacing rating. LDS means logical data source. In our project we have two logical data source one is Voucher data and the other is the Account code data (i.e. Chart of accounts data). Following are the important points to be noted which determine the interfacing:-
Below is the table which defines complexity level according to number of LDS and Functions impacting on the LDS.
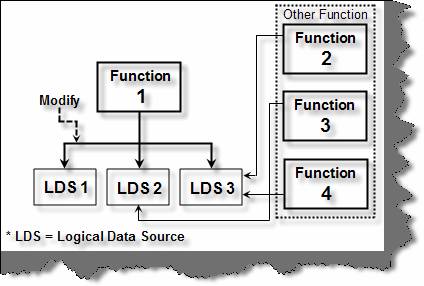
Figure: - LDS and the function concept
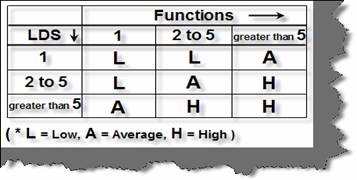
Figure: - LDS ratings
So now depending on the two points defined above lets try to find out the interfacing value for our accounting project. As said previously we have two functions which modify LDS in our project one is the Add Voucher which affects the Voucher data and Add account code which affects the Chart of Accounts code (i.e. the Accounts code master). So first let’s see Add voucher function, below is the diagram which explains in detail which LDS and functions are involved in the same. Add voucher primarily affects Voucher data LDF. But other functions like reports and print also use the LDS. So in total there are five numbers of functions and one LDS. Now looking at the number of LDS and number of function table the impact complexity factor is LOW.
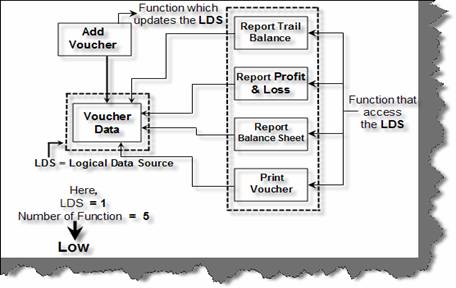
Figure: - Add voucher data
The other function which does modification is the Add account code. The LDS affected is the chart of account code and the function which affects it is the Add account code function. There are other functions who indirectly affect this function for instance report which needs to access account code , print voucher which uses the account code to print account description and also the Add voucher function uses the chart of accounts code LDS to validate if the account code is proper or not. So again we see the look up table and the impact complexity factor is AVERAGE.
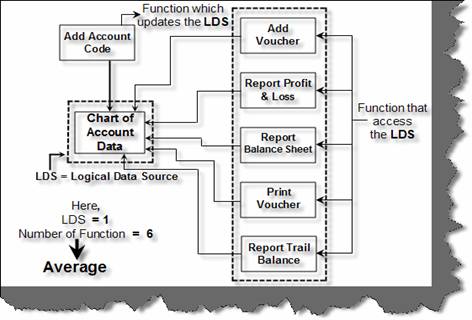
Figure: - Add account code LDS and functions
The other function factors do not modify any data so we give them a LOW rating. Below is the interfacing complexity factor assigned below.
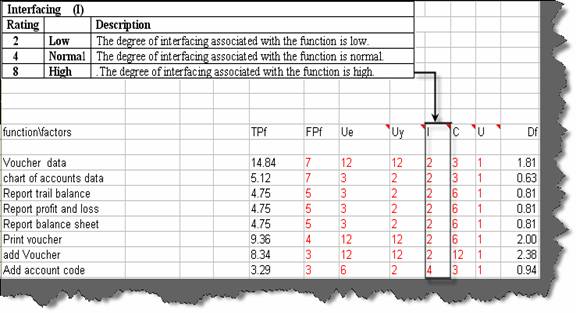
Figure: - Interfacing
Complexity (C):- This factor defines how complex is the algorithm for the particular function factor. Add voucher is the most complex functionality in the project and it can have more than eleven conditions so we have rated the Complexity factor as the highest. Reports are mediumly complex and can be rated as averagely complex. So as discussed we have assigned values accordingly as shown in the figure below.
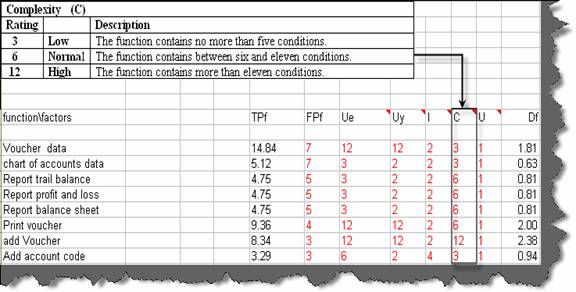
Figure: - Complexity
Uniformity (U):- This factor defines how reusable is the system. For instance if a test case written for one function can be again applied then it affects the testing estimates accordingly. Currently for this project we have taken a uniformity factor of 1. So for example if the customer had a requirement to also update accounts code. Then we could have had two functions i.e. Add voucher and update voucher, but the test case for both of them are same only with minimal change.
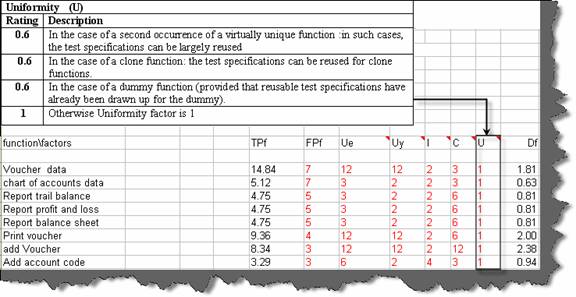
Figure: - Uniformity
One we have all the five factors we apply the below formulae to calculate Df for all the function factors.
Df = [(Ue + Uy + I + C)/16] * U
Step 3:- Calculate Qd:-
The third step is to calculate Qd. Qd i.e dynamic quality characteristics has two parts one is the explicit characteristic (Qde) and other is implicit (Qdi). Qde has five important characteristics Functionality, Security, Suitability, Performance and Portability. Below diagram shows how we rate those ratings. Qdi define the implicit characteristic part of the Qd. These are not standard and vary from project to project. For instance we have identified for this accounting application four characteristics user friendly, efficiency, performance and maintainability. From these four characteristics which ever are important we assign 0.02 value for the same. We can see from the below figure for user friendliness we have assigned 0.02 value other are left. In Qde part we have given functionality normal importance and performance as relatively unimportant but we do need to account the same. Once we have Qde and Qdi then Qd = Qde + Qdi. For this sample you can see that the total value of Qd is 1.17 (which is obtained from 1.15 + 0.02).
Qd is calculated using the rating multiplied by the value. The below table shows the rating and the next after it shows the actual value. So the 1.15 has come from the below formulae
((5 * 0.75) + (3 * 0.05) + (4 * 0.10) + (3 * 0.10) + (3 * .10)) / 4
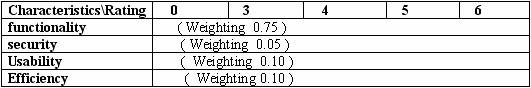
Figure: - Qd ratings
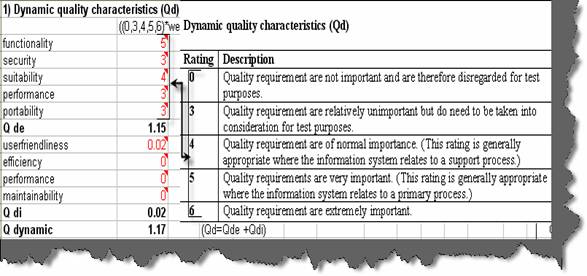
Figure: - Calculation of Qd (Dynamic characteristic)
Step 4 Calculate TPf for each function:-
In this step we calculate TPf (number of test points assigned to each function). This is done by using three data values (FPf, Df and Qd) calculated till now, below is the formulae for the same.
TPf = FPf * Df * Qd
Because we are using the excel sheet these calculations happen automatically. Below figure which shows how the TPf calculations are done.
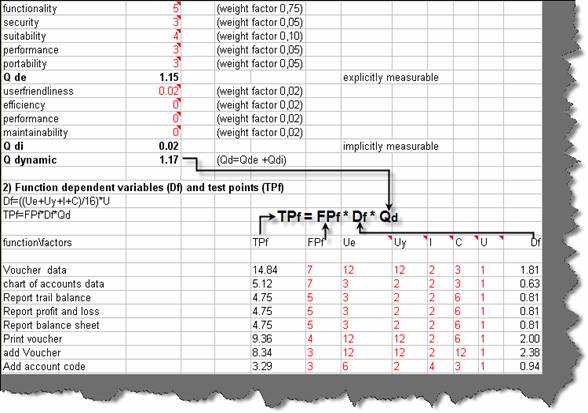
Figure: - Calculation of TPf
Step 5 Calculate static test points Qs:-
In this step we take in to account the static quality characteristic of the project. This is done by defining a check list and then if the test team needs to consider them we assign a value of 16 to those properties. For this project we have only considered easy to use as a criteria and hence assigned 16 to it.
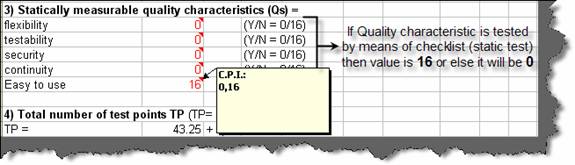
Figure: - Qs calculation
Step 6 calculate total number of test points:-
Now that we have TPf's for all function factors, FP and Qs (static test point data), its time to calculate Tp (Total number of test points).
Tp = sum(TPf) + (FP*Qs/500)
For the accounting system total Tp = 71.21 (use a calculator to check it out yourself, just makes the concept better to understand). Below is the figure which shows how the total Tp is derived.
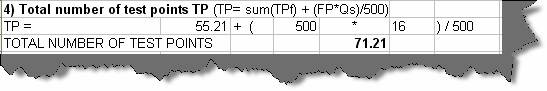
Figure: - Total number of test points
Step 7 calculate Productivity / Skill factor:-
Productivity / Skill factor shows the number of test hours needed per test points. It’s a measure of experience, knowledge, and expertise and teams ability to perform. Productivity factor vary from project to project and also organization to organization. For instance if we have project team with many seniors then the productivity increases. But if we have fresher’s who are just learning then definitely the productivity decreases. Higher the productivity factor higher is the number of test hours required.
For this project we have considered we have good resources and with great ability. So we have entered a value of 1.50 which means we have considered the highest productivity.
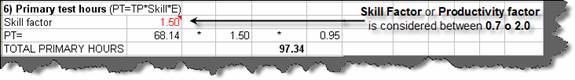
Figure: - Productivity factor / Skill factor
Step 8 Calculate environmental Factor (E):-
Number of test hours for each test point is influenced not only by skills but also the environment in which those resources work. Below figure shows the different environmental factors. You can also see the table ratings for every environmental factor.
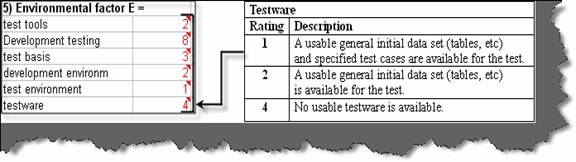
Figure :- Testware
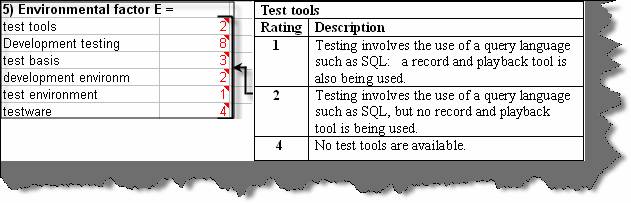
Figure: - Test tools
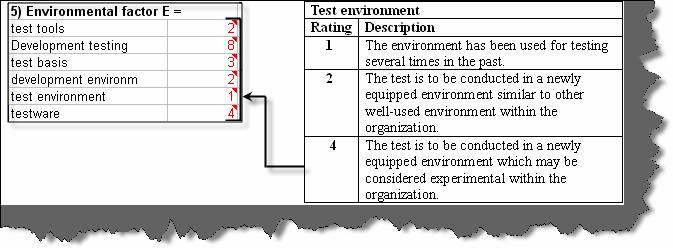
Figure: - Test environment
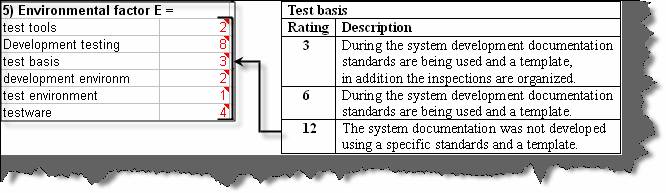
Figure :- Test basis
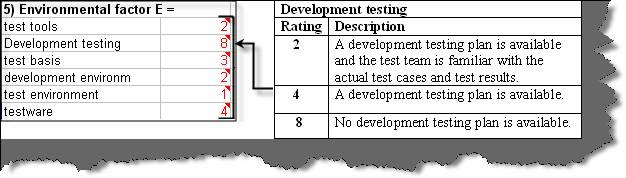
Figure: - Development testing
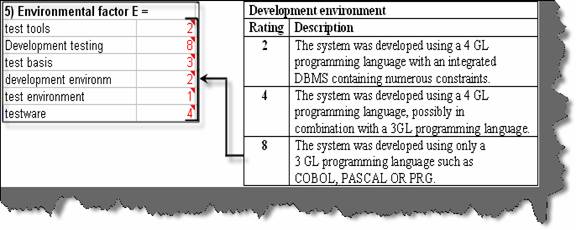
Figure: - Development environment
Step 9 Calculate primary test hours (PT):-
Primary test hours are the product of Test points, Skill factor and Environmental factors. Below formulae shows the concept in more detail:-
Primary test hours = TP * Skill factor * E
For the accounting application total primary test hours are 101.73 as shown in the figure below.
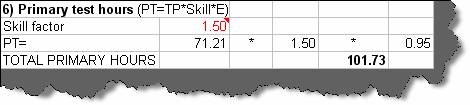
Figure: - Primary test hours
Step 10 Calculate total hours:-
Every process involves planning and management activities also. We also need to take in to account these activities. Planning and management is affected by two important concepts Team size and Management tools. So below are the rating sheet for Team size and Management tools. These but values are summed and the percentage of this value is then multiplied with the primary test hours.
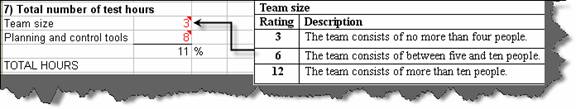
Figure: - Number of test hours
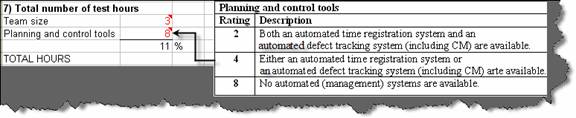
Figure: - Planning and control tools
Finally we distribute the same across the phases. So the total black box testing for this project in man is 101.73 man hours which 13 man day approximately.
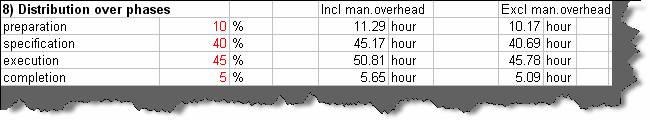
Figure: - Distribution over phases