Let’s take a small sample project. We need to make 400 breads and following is the estimation of the project:-
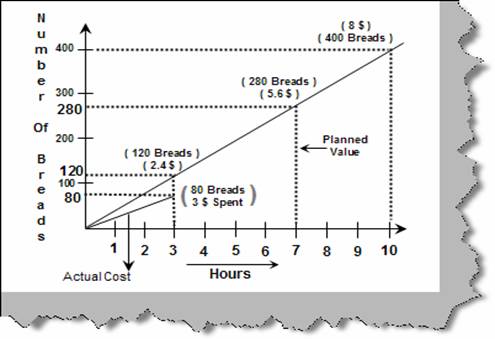
Below graph “Bread Project” shows the planned value and the actual cost graph. According to the planned value in 3 hours we will make 120 breads, in 7 hours we will make 280 breads and finally we will complete the 400 bread target in 10 hours. As the project moves ahead actually in the 3 rd hour we have only completed 80 breads with 3$ spent.
Figure: - Bread Project
Ok, now that we know the actuals its time to calculate the EV, PV and the AC.
In the 3rd hour below is the analysis.
PV (Planned value) = 120 * 0.02 = 2.4 $.
AC (Actual Cost) = 3$
Now it’s the time to calculate the earned value. Below figure ‘Earned Value for Bread’ shows the simplified view of the bread project.
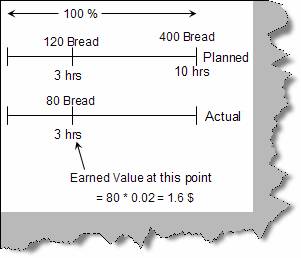
Figure: - Earned Value for Bread
EV (Earned Value) = 80 * 0.02 = 1.6$ (How much work has been completed?). So let’s do all calculations.
|
Metrics |
Calculations |
|
SV = EV - PV |
1.6 – 2.4 = -0.8 ( We are behind schedule ) |
|
CV = EV - AC |
1.6 – 3 = -1.4 ( We are over budget ) |
|
SPI = EV/PV |
1.6/2.4 = 0.6 ( We are behind schedule ) |
|
CPI = EV/AC |
1.6/3 = 0.53 ( We are over budget ) |
|
TCPI = ( Planned – EV ) / ( Final – AC ) |
(8-1.6)/(8-3) = 1.28 i.e. ( We have to perform 128 percent higher to reach our goal of making 400 breads in 10 hours ) |
You can not control what you can measure: - Demarco 87