Following are the elements of FPA.
Following are points to be noted for ILF: -
Elementary process of application.
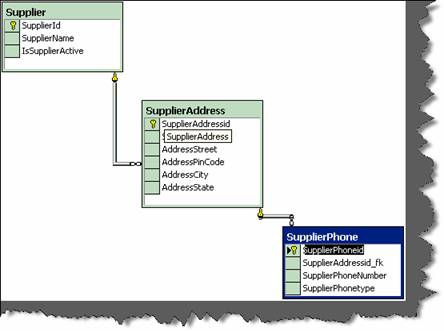
Caution: - Do not make a mistake of mapping one to one relationship between ILF and technical database design, then FPA can go very misleading. The main difference between ILF and technical database is ILF is logical view and database is physical structure (Technical Design). Example Supplier database design will have tables like Supplier, Supplier Address, SupplierPhonenumbers, but from ILF point of view its only Supplier. As logically they are all Supplier details.
Figure: - ILF example
application.
Following are points to be noted for RET
child relationship. Example: - Supplier had multiple addresses and every address
can have multiple phone numbers (See detail image below which shows database
diagrams).So Supplier, Supplier Address and Supplier phone numbers are RET’s.

Figure: - RET
Please note the whole database is one supplier ILF as all belong to one logical section. RET quantifies the relationship complexity of ILF and EIF.
Following are the points to be noted for DET counting: -
we have kept auto increment field (Supplierid) for primary key. Supplierid field
from user point of view never exists at all , its only from software designing
aspect, so does not qualifies for DET.
ILF again, it should be counted only once.
its relationship in “supplieraddress” table is counted as DET. So “Supplierid_fk”
in supplieraddress table is counted as DET. Same folds true for
“Supplieraddressid_fk”.
File Type Reference (FTR)
Following are points to be noted for FTR: -
always have one FTR in any EP.
External Input (EI)
Following are points to be noted for EI: -
Elementary Process” Section] in which data is received from external
application boundary.
Example: - User Interaction Screens, when data comes from User Interface
to Internal Application.
Example: - A calculator application does not maintain any data, but still the
screen of calculator will be counted as EI.
An import batch process running from command line does not have screen,
but still should be counted as EI as it helps passing data from External
Application Boundary to Internal Application Boundary.
External Inquiry (EQ)
Following are points to be noted for EQ: -
more ILF or EIF.
calculated data. Derived data is not just mere retrieval but are combined with
additional formulae to generate results. Derived data is not part of ILF or EIF,
they are generated on fly.
Note:- No hard and fast rules that only simple reports are EQ’s.Simple view functionality can also be counted as EQ.
External Output (EO)
Following are points to be noted for EO: -
Application Boundary to External Application Boundary.
in business.
EO’s twice.
Major difference between EO and EQ is that data passes across application boundary.
Example: - Exporting Accounts transaction to some external file format like XML or
some other format. Which later the external accounting software can import. Second
important difference is in EQ its non-derived data and EO has derived data.
General System Characteristic Section (GSC)
This section is the most important section. All the above discussed sections are counting
sections. They relate only to application. But there are other things also to be considered
while making software, like are you going to make it an N-Tier application, what's the
performance level the user is expecting etc these other factors are called GSC. These are
external factors which affect the software a lot and also the cost of it. When you submit
a function point to a client, he normally will skip everything and come to GSC first. GSC
gives us something called as VAF (Value Added Factor).
There are 14 points considered to come out with VAF (Value Added factor) and its
associated rating table.
How many communication facilities are there to aid in the transfer or exchange of
information with the application or system?
|
Rating |
Description |
|
0 |
Application is pure batch processing or a standalone PC. |
|
1 |
Application is batch but has remote data entry or remote Printing. |
|
2 |
Application is batch but has remote data entry and remote Printing. |
|
3 13
|
Application includes online data collection or TP (Teleprocessing) front end to a batch process or query system. |
|
4
|
Application is more than a front-end, but supports only one Type of TP communications protocol. |
|
5 |
Application is more than a front-end, and supports more than One type of TP communications protocol. |
Table : - Data Communication
How are distributed data and processing functions handled?
|
Rating |
Description |
|
0
|
Application does not aid the transfer of data or processing Function between components of the system. |
|
1 |
Application prepares data for end user processing on another component of the system such as PC spreadsheets and PC DBMS |
|
2 |
Data is prepared for transfer, then is transferred and processed on another component of the system (not for end-user Processing). |
|
3 |
Distributed processing and data transfer are online and in One direction only. |
|
4 |
Distributed processing and data transfer are online and in Both directions. |
|
5 |
Processing functions are dynamically performed on the most Appropriate component of the system |
Table : - Distributed data processing
Did the user require response time or throughput?
|
Rating |
Description |
|
0 |
No special performance requirements were stated by the User. |
|
1 |
Performance and design requirements were stated and Reviewed but no special actions were required. |
|
2 |
Responsetimeorthroughputiscriticalduringpeakhours.NospecialdesignforCPU utilization was required. Processing deadline is for the next business day. |
|
3 |
Response time or through put is critical during all business hours. No special design for CPU utilizationwasrequired.Processingdeadlinerequirementswithinterfacing systems Are constraining. |
|
4 |
In addition, stated user performance requirements are stringent enough to require performance analysis tasks in the Design phase. |
|
5 |
In addition, performance analysis tools were used in the design, development, and/or implementation phases to meet The stated user performance requirements. |
Table :- Performance
How heavily used is the current hardware platform where the application will be executed?
|
Rating |
Description |
|
0 |
No explicit or implicit operational restrictions are included. |
|
1 |
Operational restrictions do exist, but are less restrictive than a typical application. No special effort is needed to meet the Restrictions. |
|
2 |
Some security or timing considerations are included. |
|
3 |
Specific processor requirement for a specific piece of the Application is included. |
|
4 |
Stated operation restrictions require special constraints on the application in the central processor or a dedicated Processor. |
|
5 |
In addition, there are special constraints on the application in The distributed components of the system. |
Table : - Heavily used configuration
Transaction rate
How frequently are transactions executed; daily, weekly, monthly, etc.?
|
Rating |
Description |
|
0 |
No peak transaction period is anticipated. |
|
1 |
Peak transaction period (e.g., monthly, quarterly, seasonally, Annually) is anticipated. |
|
2 |
Weekly peak transaction period is anticipated. |
|
3 |
Daily peak transaction period is anticipated. |
|
4 |
High transaction rate(s) stated by the user in the application requirements or service level agreements are high enough to Require perform ance analysis tasks in the design phase. |
|
5 |
High transaction rate(s) stated by the user in the application requirem ents or service level agreements are high enough to require performance analysis tasks and, in addition, require the use of performance analysis tools in the design, Development, and/or installation phases. |
Table :- Transaction rate
What percentage of the information is entered On-Line?
|
Rating |
Description |
|
0 |
All transactions are processed in batch mode. |
|
1 |
1% to7% of transactions is interactive data entry. |
|
2 |
8% to15% of transactions is interactive data entry. |
|
3 |
16% to23% of transactions is interactive data entry. |
|
4 |
24% to30% of transactions is interactive data entry. |
|
5 |
M orethan30% of transactions is interactive data entry. |
Table :- Online data entry
Was the application designed for end-user efficiency? There are seven end-user efficiency factors which govern how this point is rated.
|
Sr no |
End-user Efficiency Factor |
|
1 |
Navigational aids(for example, function keys, jumps, dynamically generated menus) |
|
2 |
Menus |
|
3 |
Online help and documents |
|
4 |
Automated curs or movement |
|
5 |
Scrolling |
|
6 |
Remote printing(via online transactions) |
|
7 |
Preassigned function keys |
|
8 |
Batch jobs submitted from online transactions |
|
9 |
Cursor selection of screen data |
|
10 |
Heavy use of reverse video, highlighting, colors underlining, and other indicators |
|
11 |
Hard copy user documentation of online transactions |
|
1 2 |
Mouse interface |
|
1 3 |
Pop-up windows |
|
14 |
.As few screens as possible to accomplish a business function |
|
15 |
Bilingual support(supports two languages; count as four items) |
|
16 |
Multilingual support (supports more than two languages; count as six items). |
Table: - End user efficiency factor
|
Rating |
Description |
|
0 |
None of the above. |
|
1 |
One to three of the above. |
|
2 |
Four to five of the above. |
|
3 |
Six or more of the above, but there are no specific user Requirements related to efficiency. |
|
4 |
Six or more of the above, and stated requirements for end-user efficiency are strong enough to require design tasks for human factors to be included (for example, minimize keystrokes, maximize defaults, use of templates). |
|
5 |
Six or more of the above, and stated requirements for end-user efficiency are strong enough to require use of special tools and processes to demonstrate that the objectives have been achieved. |
Table : End user efficiency
How many ILF’s are updated by On-Line transaction?
|
Rating |
Description |
|
0 |
None of the above. |
|
1 |
Online update of one to three control files is included. Volume of updating I slow and recovery is easy. |
|
2 |
Online update off our or more control files is included. Volume of updating is low and recovery easy. |
|
3 |
Online update of major internal logical files is included. |
|
4 |
In addition, protection against data lost is essential and has been specially designed and programmed in the system. |
|
5 |
In addition, high volumes bring cost considerations into the Recovery process. Highly automated recovery procedures With minimum operator intervention are included. |
Table :- Online update
Does the application have extensive logical or mathematical processing?
|
S r no |
Complex Processing Factor |
|
1 |
Sensitive control(for example, special audit processing)and/or application specific security Processing |
|
2 |
Extensive logical processing |
|
3 |
Extensive mathematical processing |
|
4 |
Much exception processing resulting in incomplete transactions that must be processed again, for example, incomplete ATM transactions caused by TP interruption, missing data values, or failed edits |
|
5 |
Complex processing to handle multiple input/output possibilities, for example, multimedia, or device independence |
Table :- Complex processing factor
|
Rating |
Description |
|
0 |
None of the above. |
|
1 |
Any one of the above. |
|
2 |
Any two of the above. |
|
3 |
Any three of the above. |
|
4 |
Any four of the above. |
|
5 |
All five of the above |
Table: - Complex processing
Was the application developed to meet one or many user’s needs?
|
Rating |
Description |
|
0 |
No reusable code. |
|
1 |
Reusable code is used within the application. |
|
2 |
Less than 10% of the application considered more than one user's needs. |
|
3 |
Ten percent (10%) or more of the application considered more than one user's needs. |
|
4 |
The application was specifically packaged and/or documented to ease re-use, and the application is customized by the user at source code level. |
|
5 |
The application was specifically packaged and/or documented to ease re-use, and the application is customized for use by means of user parameter maintenance. |
Table : - reusability
How difficult is conversion and installation
|
Description |
Rating |
|
0 |
No special considerations were stated by the user, and no special setup is required for installation. |
|
1 |
No special considerations were stated by the user but special setup is required for installation. |
|
2 |
Conversion and installation requirements were stated by the user and conversion and installation guides were provided and tested. The impact of conversion on the project is not considered to be important. |
|
3 |
Conversion and installation requirements were stated by the user, and conversion and installation guides were provided And tested. The impact of conversion on the project is Considered to be important. |
|
4 |
In addition to 2 above, automated conversion and installation Tools were provided and tested. |
|
5 |
In addition to 3 above, automated conversion and installation Tools were provided and tested. |
Table : Installation ease
How effective and/or automated are start-up, back up, and recovery procedures?
|
Rating |
Description |
|
0 |
No special operational considerations so other than the normal Back- up procedures were stated by the user. |
|
1-4 |
One, some, or all of the following items apply to the Application. Select all that apply. Each item has a point Value of one, except as noted otherwise. |
|
Effective start-up, back-up, and recovery processes were Provided, but operator intervention is required. |
|
|
Effective start-up, back-up, and recovery processes were provided, but no operator intervention is required(count as Two items). |
|
|
The application minimizes the need for tape mounts. |
|
|
The application minimizes the need for paper handling. |
|
|
5 |
The application is designed for unattended operation. Unattended operation means no operator intervention is required to operate the system other than to startup or shutdown the application. Automatic error recovery is a feature Of the application. |
Table: - operational ease
Was the application specifically designed, developed, and supported to be installed at
multiple sites for multiple organizations?
|
Description |
Rating |
|
0 |
User requirements do not require considering the needs of More than one user/installation site. |
|
1 |
Needs of multiple sites were considered in the design, and the application is designed to operate only under identical Hardware and software environments. |
|
2 |
Needs of multiple sites were considered in the design, and the application is designed to operate only under similar Hardware and or software environments. |
|
3 |
Needs of multiple sites were considered in the design, and the application is designed to operate under different Hardware and or software environments. |
|
4 |
Documentation and support plan are provided and tested to support the application at multiple sites and the application is as described by 1 or 2. |
|
5 |
Documentation and support plan are provided and tested to support the application at multiple sites and the application is as described by 3. |
Table : - Multiple sites
Was the application specifically designed, developed, and supported to facilitate change?.
The following characteristics can apply for the application
|
Sr no |
Facilitate factors |
|
0 |
None of above |
|
1 |
Flexible query and report facility is provided that can handle simple requests; for example, and/or logic applied to only one internal logical file (count as one item). |
|
2 |
Flexible query and report facility is provided that can handle requests of average complexity for example, and/or logic applied to more than one internal logical file (count as two items). |
|
3 |
Flexible query and report facility is provided that can handle complex requests, for example, and/or logic combinations on one or more internal logical files (count as three items). |
|
4 |
Business control data is kept in tables that are maintained by the user with online interactive Processes, but changes take effect only on the next business day. |
|
5 |
Business control data is kept in tables that are maintained by the user with online interactive Processes and the changes take effect immediately (count as two items) |
Table : Facilitate change factors
|
Rating |
Description |
|
0 |
None of the above. |
|
1 |
Any one of the above. |
|
2 |
Any two of the above. |
|
3 |
Any three of the above. |
|
4 |
Any four of the above. |
|
5 |
All five of the above |
Table: - Facilitate change
All the above GSC are rated from 0-5.Then VAF is calculated from the equation below:-
VAF = 0.65 + ((sum of all GSC factor)/100).
Note: - GSC has not been accepted in software industry widely. Many software companies use Unadjusted Function point rather than adjusted. ISO has also removed GSC from its books and only kept unadjusted function points as the base for measurement. Read GSC acceptance in software industry Rating Tables for All elements of Function Points.
Below shown are look up tables which will be referred during counting.
|
EI Rating Table |
|
|
|
|
|
Data Elements |
|
|
|
FTR |
1to 4 |
5 to 15 |
Greater than 15 |
|
Less than 2 |
3 |
3 |
4 |
|
Equal to 2 |
3 |
4 |
6 |
|
Greater than 2 |
4 |
4 |
6 |
Table :- EI rating table
This table says that in any EI (External Input), if your DET count (Data Element) and
FTR (File Type Reference) exceed these limits, then this should be the FP (Function Point). Example, if your DET (data element) exceeds >15 and FTR (File Type Reference)
is greater than 2, then the Function Point count is 6. The rest down tables also show the
same things. These tables will be there before us when we are doing function point count.
The best is put these values in Excel with formulae so that you have to only put quantity
in the appropriate section and you get the final value.
|
EO Rating Table |
|||
|
|
Data Elements |
||
|
FTR |
1 to 5 |
6 to 19 |
Greater than 19 |
|
Less than 2 |
4 |
4 |
5 |
|
2 or 3 |
4 |
5 |
7 |
|
Greater than 2 |
5 |
7 |
7 |
Table :- EO rating table
|
EQ Rating Table |
|
|
|
|
|
Data Elements |
|
|
|
FTR |
1 to 5 |
6 to 19 |
Greater than 19 |
|
Less than 2 |
3 |
3 |
4 |
|
2 or 3 |
3 |
4 |
6 |
|
Greater than 2 |
4 |
6 |
6 |
Table :- EQ rating table
|
ILF Rating Table |
|||
|
|
Data Elements |
|
|
|
RET |
1 to 19 |
20 to 50 |
51 or more |
|
1 RET |
7 |
7 |
10 |
|
2 to 5 |
7 |
10 |
15 |
|
Greater than 6 |
10 |
15 |
15 |
|
EIF Rating Table |
|||
|
RET |
1 to 19 |
20 to 50 |
51 or more |
|
1 RET |
5 |
5 |
7 |
|
2 to 5 |
5 |
7 |
10 |
|
Greater than 6 |
7 |
10 |
10 |
Table :- ILF rating table.
Steps to Count Function Points
This section will discuss the practical way of counting the FP and coming out with a
Man/Days on a project.
discussed above): This whole FP count will be called as "unadjusted function
point".
come out with total VAF. Formula for VAF = 0.65 + (sum of all GSC factor/
100).
function point = VAF * Unadjusted function point.
called as "Performance factor".
]
Let’s try to implement these details in a sample customer project.
Sample Customer Project
We will be evaluating the customer GUI. So we will just scope what the customer GUI is all about.
Following is the scope of the customer screen:-
credit card check.

Figure:- Custom screen
There is one ILF in the above screen:
There is one EIF in the above form.
Following the ILF counting rules
addresses belong logically to customer category.
Elementary process of application. Customer resides in inside application
boundary as we have full access over it.
So hence goes the counting below for ILF
|
ILF Customer |
||
|
Description |
Number of DET |
Number of RET |
|
There are total 9 DETs, alladd and update buttons, even the credit check button, the address list box, check box active, all text boxes. There is only one RET, the customer addresses. |
9 |
1 |
|
So according to the above ILF ranking table |
Total function |
7 |
Table : - ILF for the customer
EIF lie outside the application boundary.
|
EI Credit Card Information |
|
|
|
|
Number of DET |
Number of RET |
|
Description |
|
|
|
The credit card information referenced is EIF. Note this file is only referenced for credit card check. There's only one textbox credit card number and hence one DET is put in the side column. And RET 0.Looking at the above rating table the total FP is 5. |
1
|
1 |
|
So according to the above ranking table |
Total function |
5 |
Table : - EI for the customer
Following EIF rules define in the previous sections:
Elementary Process” Section] in which data is received from external
application boundary. Customer detail is received from external boundary
that is customer input screen.
sample project Customer ILF is maintained.
It is two because processing logic for add and update is different.
|
EI Add Customer |
Number of DET |
Number of FTR |
|
Description |
|
|
|
There are total 9 DETs, all add and update buttons, even the credit check button, the address list box, check box active, all text boxes. There are 3 FTRs, one is the address and the second is the credit card information and third is customer himself. |
9
|
3 |
|
So according to the above ranking table |
Total function |
6 |
Table : - EI for the add customer
|
EI Update Customer |
||
|
Description |
Number of DET |
Number of RET |
|
There are total 9 DETs, all add and update buttons, even the credit check button, the address list box, check box active, all text boxes. There are 3 FTRs, one is the address and the second is the credit card information and third is customer himself. |
9
|
3 |
|
So according to the above ranking table |
Total function |
6 |
|
|
||
Table : - EI for the update customer
While counting EI I have seen many people multiplying it by 3.That means we are going
to do all CRUD functionality (ADD, UPDATE, and DELETE).This is not fair as it just
shows laziness of the Cost estimation team. Here the customer screen has add and update.
I can say the 2 * 6 that's = 12 FP for this EI customer. But later when some refers to your
FP sheet he will be completely lost.
Following are rules to recognize EO: -
Credit card check process can be complex as the credit card API complexity is still not
known. Data that is credit card information crosses from credit card system to Customer
system.
|
EO check credit card |
|
|
|
Description |
Number of DET |
Number of RET |
|
One DET Credit Card number and one RET credit card itself. Note if there are no RET we count default as one. Look for RET counting rules defined in previous section. |
1
|
1 |
|
So according to the above ranking table |
Total function |
4 |
Table :- EO to check the credit card
Following are rules to recognize EQ: -
more ILF or EIF. For editing the customer we will need to retrieve the customer
details.
customer code is inputted from the same screen.
while the customer is editing the customer data.
displayed does not contain any complex calculations.
|
EQ Display Customer Edit Information |
|
|
|
Description |
Number of DET |
Number of FTR |
|
There are 5 DETs to be retrieved Customer Code, Customer Name, Credit Card number, Active, Customer Address. Only customer details and customer address will be referenced. |
5
|
2
|
|
So according to the above ranking table |
Total function |
3 |
Table :- EQ to display customer edit
So now, let’s add the total function point got from above tables:
|
Function Point |
Section Name Counted |
|
ILF Customer |
|
|
EO Credit Card check system |
4 |
|
EIF credit card information |
5 |
|
EI Customer (Add and update) |
12 |
|
EQ display customer edit information |
3 |
|
Total Unadjusted Function Points |
31 |
Table :- Total of all function point
So unadjusted function point comes to 31.Please note I have said this as Unadjusted
function as we have not accounted other variance factor of project (Programmers leaving job, Language we will use, what architecture etc etc).
In order to make it adjusted function point, we have to calculate and tabulate the GSC
and come out with the VAF.
|
GSC |
Value(0-5) |
|
Data communications |
1 |
|
Distributed data processing |
1 |
|
Performance |
4 |
|
Heavily used configuration |
0 |
|
Transaction rate |
1 |
|
On-Line data entry |
0 |
|
End-user efficiency |
4 |
|
On-Line update |
0 |
|
Complex processing |
0 |
|
Reusability |
3 |
|
Installation ease |
4 |
|
Operational ease |
4 |
|
Multiple sites |
0 |
|
Facilitate change |
0 |
|
Total |
22 |
Table: - GSC
VAF = 0.65 + ((sum of all GSC factor)/100). = 0.65 + (22/100) = 0.87.
This factor affects the whole FP like anything, be very particular with this factor. So now,
calculating the Adjusted FP = VAF * Total unadjusted
FP = 0.87 * 31 = 26.97 = rounded to 27 FP.
Now we know that the complete FP for the customer GUI is 27 FP. Now calculating the
efficiency factor, we say that we will complete 3 FP per day that is 9 working days. So, the whole customer GUI is of 9 working days (Note do not consider Saturday and Sundays in this). I know upper manager people will say make it 7 FP per day and over load the programmer. That’s why programmer works at night.
Considering SDLC (System Development Life Cycle)
Before reading this section please refer to different SDLC cycles questions in the previous chapters.
The main intention of introducing this section is because quotations are heavily affected
by which software life cycle you follow. Because deliverables change according to SLDC
model the project manager chooses for the project. Example for waterfall model we will
have Requirement documents, Design documents, Source code and testing plans. But for
prototyping models in addition to the documents above we will also need to deliver the
rough prototype. For build and fix model we will not deliver any of the documents and
the only document delivered will be source code. So according to SDLC model deliverables change and hence the quotation. We will divide the estimation across requirement, design, implementation (coding) and testing .In what way the estimation has to divide across all deliverables is all up to the project manager and his plans.
|
Phase |
Percentage distribution effort |
|
Requirements |
10% of total effort |
|
Design Phase |
20% of total effort |
|
Coding |
100 % of total effort |
|
Testing |
10% of total effort |
Table :- Phase wise distribution of effort
The above sample is total 100 % distribution of effort across various phases. But note function point or any other estimation methodology only gives you total execution estimation. So you can see in the above distribution we have given coding as 100 %. But as said it up to the project manager to change according to scenarios .Ok now from the above function point estimation the estimation is 7 days let’s try to divide it across all phases.
|
Phase
|
Percentage distribution effort
|
Distribution of man/ days across phases
|
|
Requirements
|
10 % of total effort
|
0.9 days
|
|
Design Phase
|
20 % of total effort
|
1.8 days
|
|
Coding
|
60 % of total effort
|
7 days
|
|
Testing
|
10 % of total effort |
0.9 days |
|
Total 9 day |
|
10.6 days |
Table :- Phase wise effort distribution of man days
The above table shows the division of project man/days across project. Now let’s put
down the final quotation. Just a small comment about test cases.
Total number of Test Cases = (Function Point) raised to power of 1.2.This is as suggested
from caper Jones.