GANTT chart is a time and activity bar chart. Gantt charts are easy-to-read charts that
display the project schedule in task sequence and by the task start and finish dates. Gantt
charts are simple chart which display the project schedule in task sequence and by the
task start and finish dates. Lets consider the below given simple four activity network
figure.
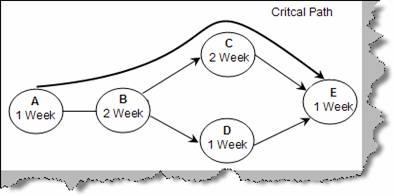
Figure: -Simple Activity Network
We have circled the activity and also mentioned the time duration required in weeks. For
instance Activity A requires 1 week, Activity B requires 2 weeks and so on. Now let’s
construct a simple GANTT chart for the simple network activity diagram. GANTT chart
is an illustration of time and activities. Below figure ‘GANTT CHART’ is how the network activity will look when viewed in GANTT chart format. In GANTT chart we put
down the activities in the vertical axis and the time scale on the horizontal axis. So on the
vertical axis we have listed down ‘Task A’, ‘Task B’, ‘Task C’ and so on. While on the
horizontal axis we have listed down the time in weeks. There is one more column
duration added for reference. One the most important component in GANTT chart is the
activity bar which represents an activity. Below figure ‘Activity Bar’ shows how we
represent an activity. The start of the activity is represented by a top arrow and the end by
a down arrow.
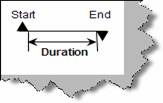
Figure: -Activity Bar
So we list down all activities and start drawing the activity bar according to duration.
Once done the final output is as shown in figure ‘GANTT chart’. The top bar shows the
total activity period. Dependencies are shown by one arrow connecting to the other
arrow; we have circled how the dependencies are shown. Task B can only start if task A
is completed. GNATT chart is a helpful way to communicate schedule information to top management since it provides an easy-to-read visual picture of the project activities.
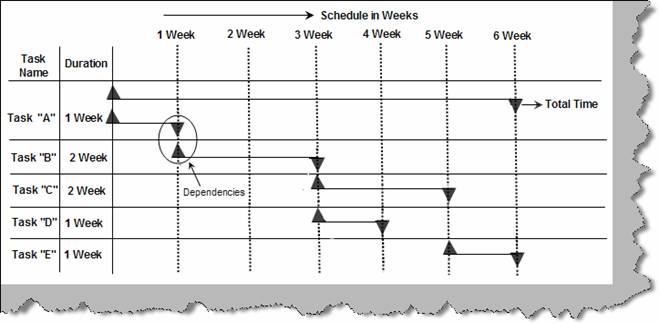
Figure: -GANTT Chart